
You are using an out of date browser. It may not display this or other websites correctly.
You should upgrade or use an alternative browser.
You should upgrade or use an alternative browser.
[NPS] NiX Proxy Suite looking for testers and translators
- Thread starter NIXMY
- Start date
- Status
- Not open for further replies.

NIXMY
Regular Member
- Sep 26, 2010
- 481
- 322
Current format that it does write to a text file is not most user-friendly to parse (i will fix it upon next update). Im currently working with the proxy leecher previously requested features. I'll also add 'filters' mentined in your previous post to the proxy checker. Expect another update during this week.
PS. Read your PM's.
PS. Read your PM's.
Ok i did a first test Windows XAMPP
Leecher :
manually added 32 proxy sites ( i wished at that moment you had added the import feature ! )
)
connection timeout 2sec
timeout 20 sec
threads 50
sub threads 4
10:55 started leeching
10:59 finished. 17039 proxies leeched
Total unique 12,217
Check proxy .. had to find the link to check them as in /nps/ the link Check Proxies goes to "to be implemented" so i figured it out ..went to "Proxy Scrapring" .. View my list of 17039 and then at the top pressed "Check All unique proxies"
connection timeout 2sec
timeout 10 sec
thread : 20
sub : 10
retries 2
start 11:03
ends : 11:04
Proxy check has finished.Checked 298 proxies.Operation completed in 0 days 00 hours 01 minutes 32 seconds
i did it again and got same results .. Checked 298 proxies
Out of that i got 60 working proxies. Percent complete 100%
Yeah i checked proxies.txt and i thought i was gonna get 1 proxy per line .. but i got all the info like:
Key: connect_time Value: 0.34
Key: total_time Value: 1.44
Key: anonylevel Value: 1
Key: proxy Value: 41.158.128.190:80
Key: proxy_type Value: http
Key: connect Value: no
Key: smtp Value: no
Key: country Value: -
Key: country_code Value: -
Key: region Value: -
Key: city Value: -
So in this version any way to get the list of 1 per line like
IPort
IPort
?
On http://127.0.0.1/nps/index.php?p=user&tool=proxy-checker&action=proxy-checks, i clicked in action tab "View" but got "There were no results according to your request"
Okay i am sure i have made mistakes .. that was a quick first test
Leecher :
manually added 32 proxy sites ( i wished at that moment you had added the import feature !
)connection timeout 2sec
timeout 20 sec
threads 50
sub threads 4
10:55 started leeching
10:59 finished. 17039 proxies leeched
Total unique 12,217
Check proxy .. had to find the link to check them as in /nps/ the link Check Proxies goes to "to be implemented" so i figured it out ..went to "Proxy Scrapring" .. View my list of 17039 and then at the top pressed "Check All unique proxies"
connection timeout 2sec
timeout 10 sec
thread : 20
sub : 10
retries 2
start 11:03
ends : 11:04
Proxy check has finished.Checked 298 proxies.Operation completed in 0 days 00 hours 01 minutes 32 seconds
i did it again and got same results .. Checked 298 proxies
Out of that i got 60 working proxies. Percent complete 100%
Yeah i checked proxies.txt and i thought i was gonna get 1 proxy per line .. but i got all the info like:
Key: connect_time Value: 0.34
Key: total_time Value: 1.44
Key: anonylevel Value: 1
Key: proxy Value: 41.158.128.190:80
Key: proxy_type Value: http
Key: connect Value: no
Key: smtp Value: no
Key: country Value: -
Key: country_code Value: -
Key: region Value: -
Key: city Value: -
So in this version any way to get the list of 1 per line like
IP
ortIP
ort?
On http://127.0.0.1/nps/index.php?p=user&tool=proxy-checker&action=proxy-checks, i clicked in action tab "View" but got "There were no results according to your request"
Okay i am sure i have made mistakes .. that was a quick first test
okay i ran a 2nd test with the new updated files
Checking proxies is working better now for me
Did a small test :
Scrapped 5112 proxies
Checked proxy with low threads to begin (threads 10 and sub 5) TOTAL PROCESS TIME 0:00:23:35
WORKING PROXIES :611
Proxy check has finished.Checked 1569 proxies.Operation completed in 0 days 00 hours 23 minutes 35 seconds
But i am confused ..why script says "Checked 1569 proxies" .. why not the full list of 5112 ??
Checking proxies is working better now for me
Did a small test :
Scrapped 5112 proxies
Checked proxy with low threads to begin (threads 10 and sub 5) TOTAL PROCESS TIME 0:00:23:35
WORKING PROXIES :611
Proxy check has finished.Checked 1569 proxies.Operation completed in 0 days 00 hours 23 minutes 35 seconds
But i am confused ..why script says "Checked 1569 proxies" .. why not the full list of 5112 ??
NIXMY
Regular Member
- Sep 26, 2010
- 481
- 322
Ok i did a first test Windows XAMPP
Leecher :
manually added 32 proxy sites ( i wished at that moment you had added the import feature !
connection timeout 2sec
timeout 20 sec
threads 50
sub threads 4
10:55 started leeching
10:59 finished. 17039 proxies leeched
Total unique 12,217
Check proxy .. had to find the link to check them as in /nps/ the link Check Proxies goes to "to be implemented" so i figured it out ..went to "Proxy Scrapring" .. View my list of 17039 and then at the top pressed "Check All unique proxies"
connection timeout 2sec
timeout 10 sec
thread : 20
sub : 10
retries 2
start 11:03
ends : 11:04
Proxy check has finished.Checked 298 proxies.Operation completed in 0 days 00 hours 01 minutes 32 seconds
i did it again and got same results .. Checked 298 proxies
Out of that i got 60 working proxies. Percent complete 100%
Yeah i checked proxies.txt and i thought i was gonna get 1 proxy per line .. but i got all the info like:
Key: connect_time Value: 0.34
Key: total_time Value: 1.44
Key: anonylevel Value: 1
Key: proxy Value: 41.158.128.190:80
Key: proxy_type Value: http
Key: connect Value: no
Key: smtp Value: no
Key: country Value: -
Key: country_code Value: -
Key: region Value: -
Key: city Value: -
So in this version any way to get the list of 1 per line like
IP
IP
?
On http://127.0.0.1/nps/index.php?p=user&tool=proxy-checker&action=proxy-checks, i clicked in action tab "View" but got "There were no results according to your request"
Okay i am sure i have made mistakes .. that was a quick first test
You get 'There were no results according to your request' because full database support is not implemented yet. That's why it writes proxies to a file. The version you have is primarily meant to test proxy checker reliability. I can fix to the next version proxy format.
<<because full database support is not implemented yet.>>
OK gotcha ya .. as i am testing, i am trying to click everything and report
I don't know for others but i use softwares that requires proxy lists as IP : Port so it would be great to have that feature if possible
OK gotcha ya .. as i am testing, i am trying to click everything and report
I don't know for others but i use softwares that requires proxy lists as IP : Port so it would be great to have that feature if possible
NIXMY
Regular Member
- Sep 26, 2010
- 481
- 322
okay i ran a 2nd test with the new updated files
Checking proxies is working better now for me
Did a small test :
Scrapped 5112 proxies
Checked proxy with low threads to begin (threads 10 and sub 5) TOTAL PROCESS TIME 0:00:23:35
WORKING PROXIES :611
Proxy check has finished.Checked 1569 proxies.Operation completed in 0 days 00 hours 23 minutes 35 seconds
But i am confused ..why script says "Checked 1569 proxies" .. why not the full list of 5112 ??
Maybe because 1569 was unique amount? Did you limited the check to N amount of proxy? How many 'chunks' real-time progress meter showed to you during this check?
4th test
30 threads 20 sub threads
4521 scrapped proxies
4061 Unique proxies
Limited to N proxy (as like that before anyway but i confirm ..in settings, limit is 0)
[123/123] 100/100 % Uptime [d:h:m:s]: 0:00:15:48 Estimated time left: 0 days, 00 hours, 00 minutes, 00 seconds.
123 lines total
Proxy check has finished.Checked 3685 proxies.Operation completed in 0 days 00 hours 16 minutes 06 second
30 threads 20 sub threads
4521 scrapped proxies
4061 Unique proxies
Limited to N proxy (as like that before anyway but i confirm ..in settings, limit is 0)
[123/123] 100/100 % Uptime [d:h:m:s]: 0:00:15:48 Estimated time left: 0 days, 00 hours, 00 minutes, 00 seconds.
123 lines total
Proxy check has finished.Checked 3685 proxies.Operation completed in 0 days 00 hours 16 minutes 06 second
5th test .. i thought maybe i had too many threads for the pc and the connection so i tried this
Connection timeout: 2 Timeout: 10 Threads: 10 Sub threads: 10 Retries: 2 This check is limited to N proxy: No limit Protocol: AUTODETECT
proxies total
5882
Total unique proxies: 4,741
Proxy check has finished.Checked 364 proxies.Operation completed in 0 days 00 hours 02 minutes 22 seconds
I must do something wrong ... i will delete Db and try again
Connection timeout: 2 Timeout: 10 Threads: 10 Sub threads: 10 Retries: 2 This check is limited to N proxy: No limit Protocol: AUTODETECT
proxies total
5882
Total unique proxies: 4,741
Proxy check has finished.Checked 364 proxies.Operation completed in 0 days 00 hours 02 minutes 22 seconds
I must do something wrong ... i will delete Db and try again
NIXMY
Regular Member
- Sep 26, 2010
- 481
- 322
you mean how many lines of results like this one
[24/123] 19.51/100 % Uptime [d:h:m:s]: 0:00:03:08 Estimated time left: 0 days, 00 hours, 12 minutes, 58 seconds.
?
i will post when current test is finished
That means you have 123 chunks in total to be checked, if you had threads set to 20, that would mean 20x123 proxies. I'll take a look at those stat counters to see is there a hidden bug.
NIXMY
Regular Member
- Sep 26, 2010
- 481
- 322
5th test .. i thought maybe i had too many threads for the pc and the connection so i tried this
Connection timeout: 2 Timeout: 10 Threads: 10 Sub threads: 10 Retries: 2 This check is limited to N proxy: No limit Protocol: AUTODETECT
proxies total
5882
Total unique proxies: 4,741
Proxy check has finished.Checked 364 proxies.Operation completed in 0 days 00 hours 02 minutes 22 seconds
I must do something wrong ... i will delete Db and try again
Are you testing NPS on windows? Maybe the half-open connection limit kicked in? Could you tell me your OS and your connection speed? Remember also if you leech very large lists, it could be you will end up with no working proxy.
According to your current results, 10 threads and 5 sub seems to work but whenever you go over 10 threads, you have bad results or no results at all? You can of course reset database by re-importing all tables but I doubt it fixes your issue.
Thanks so far for all tests and reports.
A paste from install.txt just in case you missed it.
----------------------------------------
NOTES for WinXP/Vista users
----------------------------------------
DO NOT FORGET TO PATCH TCPIP.SYS SIMULTANEOUS CONNECTIONS LIMIT
Download http://deepxw.blogspot.com/2009/01/download-latest-version.html and follow
the instructions inside the package. Without patching the limit, you will have very unreliable results.
If you experience bad results with higher threads, I suggest you to try TCP-Z also on Win7. It will patch the 'limit' in kernel memory, you absolutely lose nothing by testing it. According to my own tests, it seems this patch is not needed on Windows 7 Enterprise SP1.
I suggest to use TCP-Z anyway especially for monitoring, it shows you the amount of active connections such as half-open ones, this way I verified NPS on win7 that the requested amount of connections went through.
i am testing on windows 7 Ultimate
Connection speed test here : http://www.speedtest.net/result/1982674933.png
i had the TCP-Z open and changed the limit to 124 (more than 100 to be sure that i had no problem)
and if you see test report #4 and #5 i had more proxies tested with higher threads. i lowered them to 10 for the last test and it checked fewer proxies
I will start again tomorrow .. first with low threads, then increase and see results FOR SAME proxy leeched list so i can compare how many proxies were checked using different # of threads
Connection speed test here : http://www.speedtest.net/result/1982674933.png
i had the TCP-Z open and changed the limit to 124 (more than 100 to be sure that i had no problem)
and if you see test report #4 and #5 i had more proxies tested with higher threads. i lowered them to 10 for the last test and it checked fewer proxies
I will start again tomorrow .. first with low threads, then increase and see results FOR SAME proxy leeched list so i can compare how many proxies were checked using different # of threads
NIXMY
Regular Member
- Sep 26, 2010
- 481
- 322
Im worried about your upload speed, barely 0.5Mbit. There is currently in NPS one setting that is not user configurable, I believe this value is too small for your connection. I will make asynchronous timeout also configurable for the next version. This setting will be set in ms unlike the other timeouts.
Open the command prompt and copy/paste without single quotes 'ping 210.224.168.100'
Let me know the ping.
Open the command prompt and copy/paste without single quotes 'ping 210.224.168.100'
Let me know the ping.


ajithrocksca
Senior Member
- Dec 23, 2010
- 1,104
- 595
Hi, will try this one out in my pc (windows 7 64 bit and a connection speed of 50/15 mbps).
ok something is wrong for me and i fear it is my pc
6th test :
Total unique proxies: 6,126
Current settings
Connection timeout: 2 Timeout: 20 Threads: 30 Sub threads: 10 Retries: 2 This check is limited to N proxy: No limit Protocol: AUTODETECT
[1/1] 100/100 % Uptime [d:h:m:s]: 0:00:00:10 Estimated time left: 0 days, 00 hours, 00 minutes, 00 seconds.
Waiting for the running [9] threads...
Proxy check has finished.Checked 25 proxies.Operation completed in 0 days 00 hours 00 minutes 37 seconds
7th test :
Same proxies list
Connection timeout: 5 Timeout: 20 Threads: 5 Sub threads: 5 Retries: 1 This check is limited to N proxy: No limit Protocol: AUTODETECT
[1/5] 20/100 % Uptime [d:h:m:s]: 0:00:00:01 Estimated time left: 0 days, 00 hours, 00 minutes, 04 seconds.
[2/5] 40/100 % Uptime [d:h:m:s]: 0:00:00:03 Estimated time left: 0 days, 00 hours, 00 minutes, 05 seconds.
[3/5] 60/100 % Uptime [d:h:m:s]: 0:00:00:07 Estimated time left: 0 days, 00 hours, 00 minutes, 05 seconds.
[4/5] 80/100 % Uptime [d:h:m:s]: 0:00:00:20 Estimated time left: 0 days, 00 hours, 00 minutes, 05 seconds.
[5/5] 100/100 % Uptime [d:h:m:s]: 0:00:00:27 Estimated time left: 0 days, 00 hours, 00 minutes, 00 seconds.
Waiting for the running [4] threads...
Proxy check has finished.Checked 25 proxies.Operation completed in 0 days 00 hours 00 minutes 37 seconds
Total checked 25 proxies no matter what settings i set for proxy checker
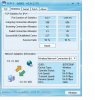
See attachment of tcp-z
6th test :
Total unique proxies: 6,126
Current settings
Connection timeout: 2 Timeout: 20 Threads: 30 Sub threads: 10 Retries: 2 This check is limited to N proxy: No limit Protocol: AUTODETECT
[1/1] 100/100 % Uptime [d:h:m:s]: 0:00:00:10 Estimated time left: 0 days, 00 hours, 00 minutes, 00 seconds.
Waiting for the running [9] threads...
Proxy check has finished.Checked 25 proxies.Operation completed in 0 days 00 hours 00 minutes 37 seconds
7th test :
Same proxies list
Connection timeout: 5 Timeout: 20 Threads: 5 Sub threads: 5 Retries: 1 This check is limited to N proxy: No limit Protocol: AUTODETECT
[1/5] 20/100 % Uptime [d:h:m:s]: 0:00:00:01 Estimated time left: 0 days, 00 hours, 00 minutes, 04 seconds.
[2/5] 40/100 % Uptime [d:h:m:s]: 0:00:00:03 Estimated time left: 0 days, 00 hours, 00 minutes, 05 seconds.
[3/5] 60/100 % Uptime [d:h:m:s]: 0:00:00:07 Estimated time left: 0 days, 00 hours, 00 minutes, 05 seconds.
[4/5] 80/100 % Uptime [d:h:m:s]: 0:00:00:20 Estimated time left: 0 days, 00 hours, 00 minutes, 05 seconds.
[5/5] 100/100 % Uptime [d:h:m:s]: 0:00:00:27 Estimated time left: 0 days, 00 hours, 00 minutes, 00 seconds.
Waiting for the running [4] threads...
Proxy check has finished.Checked 25 proxies.Operation completed in 0 days 00 hours 00 minutes 37 seconds
Total checked 25 proxies no matter what settings i set for proxy checker
See attachment of tcp-z
i re leeched proxies using same sources and this time i got less proxies (8140 .. unique 5279).. wonder why i dont get the same amount as 15 min ago
changed proxies checker settings to Connection timeout : 5 . Timeout : 20 . Threads : 30 . subthreads : 10
and the proxy checking process is currently working :
[1/53] 1.89/100 % Uptime [d:h:m:s]: 0:00:00:28 Estimated time left: 0 days, 00 hours, 24 minutes, 25 seconds.
[2/53] 3.77/100 % Uptime [d:h:m:s]: 0:00:00:48 Estimated time left: 0 days, 00 hours, 20 minutes, 41 seconds.
[3/53] 5.66/100 % Uptime [d:h:m:s]: 0:00:01:08 Estimated time left: 0 days, 00 hours, 18 minutes, 58 seconds.
[4/53] 7.55/100 % Uptime [d:h:m:s]: 0:00:01:25 Estimated time left: 0 days, 00 hours, 17 minutes, 30 seconds.
[5/53] 9.43/100 % Uptime [d:h:m:s]: 0:00:01:44 Estimated time left: 0 days, 00 hours, 16 minutes, 44 seconds.
[6/53] 11.32/100 % Uptime [d:h:m:s]: 0:00:02:08 Estimated time left: 0 days, 00 hours, 16 minutes, 48 seconds.
[7/53] 13.21/100 % Uptime [d:h:m:s]: 0:00:02:32 Estimated time left: 0 days, 00 hours, 16 minutes, 39 seconds.
[8/53] 15.09/100 % Uptime [d:h:m:s]: 0:00:02:53 Estimated time left: 0 days, 00 hours, 16 minutes, 14 seconds.
[9/53] 16.98/100 % Uptime [d:h:m:s]: 0:00:03:13 Estimated time left: 0 days, 00 hours, 15 minutes, 44 seconds.
[10/53] 18.87/100 % Uptime [d:h:m:s]: 0:00:03:34 Estimated time left: 0 days, 00 hours, 15 minutes, 20 seconds.
drives me nuts
changed proxies checker settings to Connection timeout : 5 . Timeout : 20 . Threads : 30 . subthreads : 10
and the proxy checking process is currently working :
[1/53] 1.89/100 % Uptime [d:h:m:s]: 0:00:00:28 Estimated time left: 0 days, 00 hours, 24 minutes, 25 seconds.
[2/53] 3.77/100 % Uptime [d:h:m:s]: 0:00:00:48 Estimated time left: 0 days, 00 hours, 20 minutes, 41 seconds.
[3/53] 5.66/100 % Uptime [d:h:m:s]: 0:00:01:08 Estimated time left: 0 days, 00 hours, 18 minutes, 58 seconds.
[4/53] 7.55/100 % Uptime [d:h:m:s]: 0:00:01:25 Estimated time left: 0 days, 00 hours, 17 minutes, 30 seconds.
[5/53] 9.43/100 % Uptime [d:h:m:s]: 0:00:01:44 Estimated time left: 0 days, 00 hours, 16 minutes, 44 seconds.
[6/53] 11.32/100 % Uptime [d:h:m:s]: 0:00:02:08 Estimated time left: 0 days, 00 hours, 16 minutes, 48 seconds.
[7/53] 13.21/100 % Uptime [d:h:m:s]: 0:00:02:32 Estimated time left: 0 days, 00 hours, 16 minutes, 39 seconds.
[8/53] 15.09/100 % Uptime [d:h:m:s]: 0:00:02:53 Estimated time left: 0 days, 00 hours, 16 minutes, 14 seconds.
[9/53] 16.98/100 % Uptime [d:h:m:s]: 0:00:03:13 Estimated time left: 0 days, 00 hours, 15 minutes, 44 seconds.
[10/53] 18.87/100 % Uptime [d:h:m:s]: 0:00:03:34 Estimated time left: 0 days, 00 hours, 15 minutes, 20 seconds.
drives me nuts
- Status
- Not open for further replies.