

- Nov 26, 2015
- 4,750
- 1,048
Here we can see the Consumer Behavior Index;
There was a recent survey with US consumers on how they practice and prioritize while interacting Offline and online with local businesses around 1000+ consumers
U.S. consumers frequently search online for local businesses, with 80% doing so at least weekly and 32% searching daily. Restaurants, grocery stores, and retail stores are the most commonly searched categories. Google Maps and Facebook are the primary tools used for these searches, and users generally report moderate to high satisfaction with their online searches.

How they Respond to the Online Profiles status:
According to the survey 15% of consumers frequently get inaccurate information about online local businesses and the bad information hurts the businesses. When questioned them what they do if they got the wrong information 47% of consumers said they would look for another business.
This is the flow of how they react to information;

Consumers use the App either as Search or Social:
In late 2022 a survey revealed that 40% of Genz customers would use either TikTok or Instagram rather than Google to have a lunch or dinner. But 64% of consumers only use it for Local businesses. The below picture shows the exact information of what kind of apps they are using most of the time.

Target Audience:
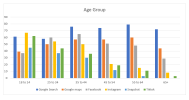
Survey results show that among consumers aged 18 to 24, Instagram is the top local search tool, used by 67%, followed by TikTok at 62% and Google Search at 61%. This indicates that Gen Z prefers social apps for local searches, while Google Search remains the top choice for older age groups. Businesses targeting diverse age groups should focus on both search and social platforms, as social media now holds a significant advantage for reaching younger consumers.
Here are the complete Stats of the different ages of people using the Apps;
Depend on feedback and Ratings:
Consumers heavily rely on online reviews and social media when making purchasing decisions, with 88% regularly reading reviews before buying. Star ratings are also crucial, as 77% of consumers prefer businesses with at least three stars out of five. The accompanying graph illustrates the frequency with which consumers read reviews before selecting a local business.

The minimum star rating the business must have to consider to visit or contact them:

This is how people are using the apps we will optimize our businesses according to their needs.
There was a recent survey with US consumers on how they practice and prioritize while interacting Offline and online with local businesses around 1000+ consumers
- The sites and the apps they used to research and find the local business
- Peer Feedback about the business consumers use and provide
- Open lines of communication between consumers and Local Businesses
U.S. consumers frequently search online for local businesses, with 80% doing so at least weekly and 32% searching daily. Restaurants, grocery stores, and retail stores are the most commonly searched categories. Google Maps and Facebook are the primary tools used for these searches, and users generally report moderate to high satisfaction with their online searches.
According to the survey 15% of consumers frequently get inaccurate information about online local businesses and the bad information hurts the businesses. When questioned them what they do if they got the wrong information 47% of consumers said they would look for another business.
This is the flow of how they react to information;
In late 2022 a survey revealed that 40% of Genz customers would use either TikTok or Instagram rather than Google to have a lunch or dinner. But 64% of consumers only use it for Local businesses. The below picture shows the exact information of what kind of apps they are using most of the time.
Survey results show that among consumers aged 18 to 24, Instagram is the top local search tool, used by 67%, followed by TikTok at 62% and Google Search at 61%. This indicates that Gen Z prefers social apps for local searches, while Google Search remains the top choice for older age groups. Businesses targeting diverse age groups should focus on both search and social platforms, as social media now holds a significant advantage for reaching younger consumers.
Here are the complete Stats of the different ages of people using the Apps;
Consumers heavily rely on online reviews and social media when making purchasing decisions, with 88% regularly reading reviews before buying. Star ratings are also crucial, as 77% of consumers prefer businesses with at least three stars out of five. The accompanying graph illustrates the frequency with which consumers read reviews before selecting a local business.
