
D
Deleted member 969102
Guest
After my latest thread explaining How To Actually Buy & Trade Cryptocurrencies, I figured that the next logical thing to post would be a short (ish) guide explaining the best ways to track Cryptocurrency prices.
Hands down, the best place to start out is Coinmarketcap.com. They're the biggest price-tracking platform out there, supporting 1384 cryptos at the time of writing this. From the home screen, you can view the top one hundred coins, sorted by market cap. You also have the ability to sort them by price, volume, circulating supply, 24hour percentage change.
After navigating to a specific crypto (click the name) you can then view pretty much all of the relevant information, from the official website(s) to the historical price changes and even social media feeds.
Having all of the lines enabled on the price graph can often be annoying, so you may want to disable some. Simply click on the colourized options to disable them and the grey ones to enable them again.

While we're on the topic of price, it's almost always a good idea to look at/calculate the price in BTC and not USD. Not only is this more accurate, as it doesn't rely on multiple currency conversion, but it's also important to know your profit % in Bitcoin as well as USD otherwise your portfolio could be increasing in fiat value, but decreasing in BTC. (Not relevant for the above image, as it was the Bitcoin chart)
They calculate the price based on a weighted-average from all of the exchanges trading the coin (Meaning the price on exchanges with higher volumes has a bigger influence on the overall price) and you can get a (slightly outdated) price for a specific exchange by navigating to the "markets" tab.
The only negative thing about CoinMarketCap is that they (currently) don't offer any sort of personalized view. If you're really into crypto, like me, you may want to create a customized dashboard using their HTML widgets. This is really easy to do and you don't even need to purchase a domain (unless you want to view it externally).

Alternatively, you can install the CoinMarketCap Enhanced Chrome Extension, which offers some nice features over the standard version, but is exclusive to chrome.
The charts page has some really interesting graphs that are a good idea to look at, such as the market dominance graph.
Trading View:
For those of you who want to get a bit more technical and view more accurate prices, Tradingview.com/chart/ is a great place to look.
By default, it will probably load in Apple's share price. You can change this to a cryptocurrency of your choosing by searching for the symbol in the top-left box. You will probably notice that there are multiple results for each crypto. This is because they allow you to pick (for some coins) the currency you would like to compare it to. For example, NEOBTC is the NEO price in BTC.
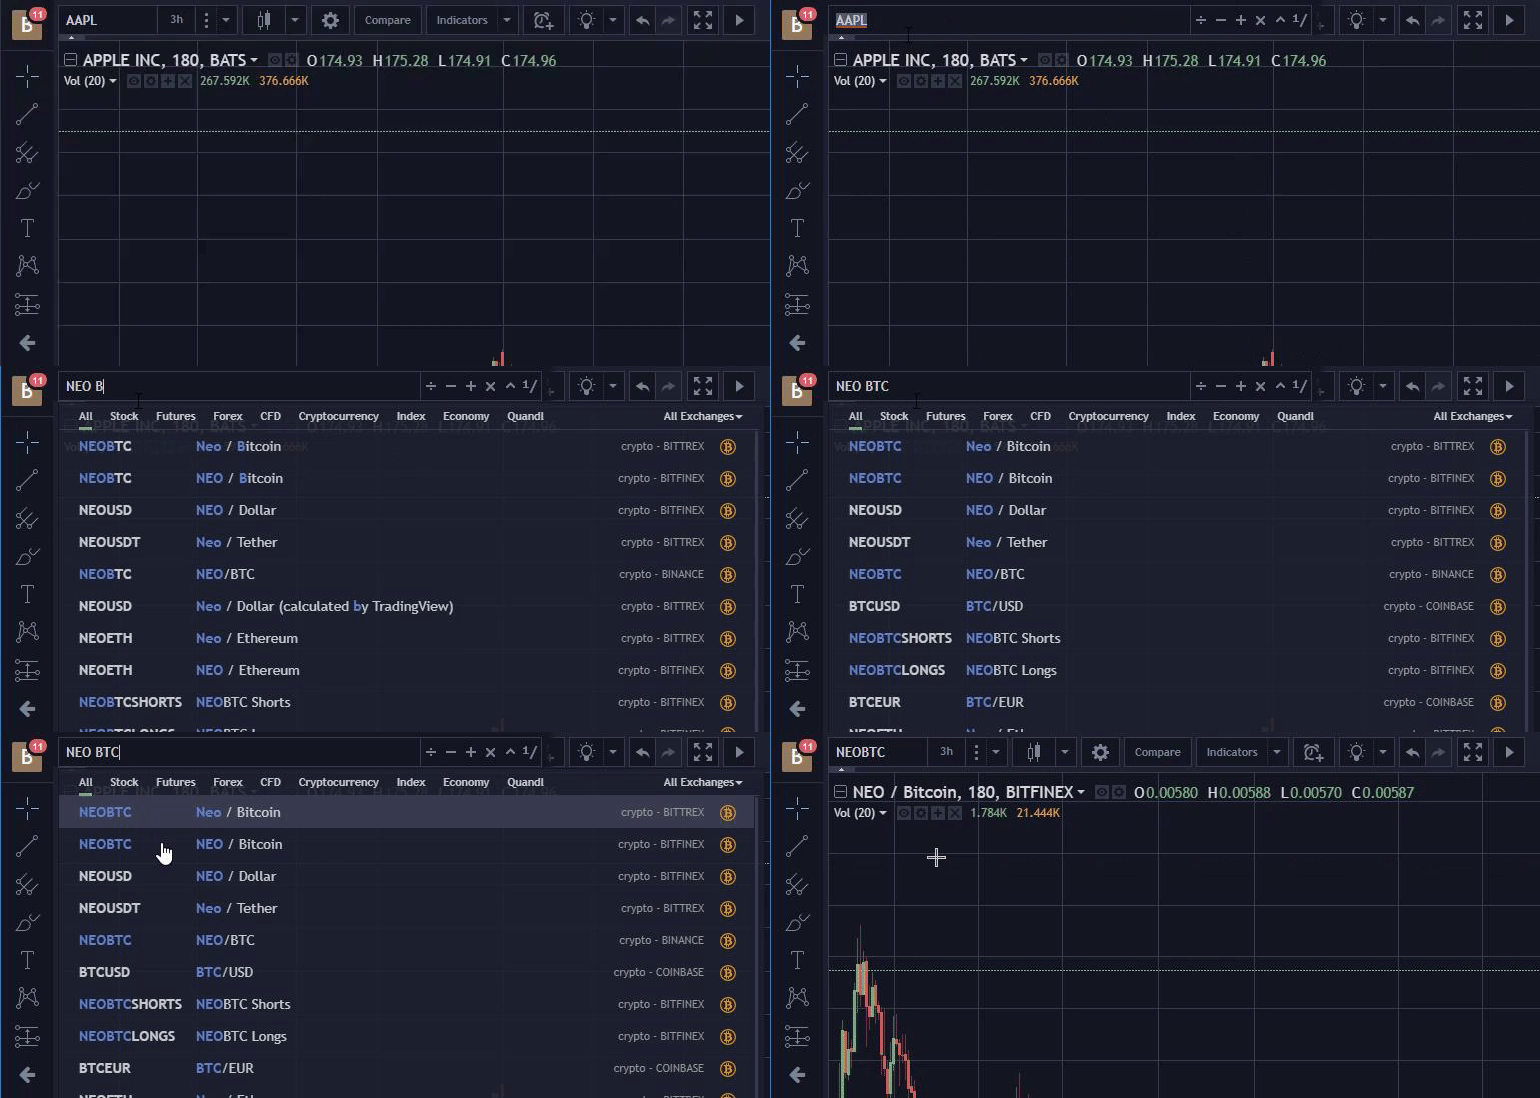
You may also notice that there are multiple charts for NEOBTC. This is because trading view allows you to view the price on specific exchanges. This is one of the main reasons I use Trading view, as it allows me to view the price on the exchange I have that specific coin on, yet quickly view another coin on a separate exchange.
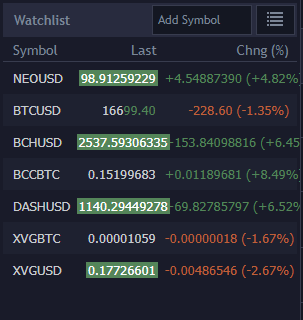
You can keep track of multiple coins while viewing a specific chart by adding them to your watchlist in the top-right of the screen.

Coming back to the top toolbar, there are a few more options that you may find useful. Clicking on the time will allow you to change the chart intervals, anywhere from 1 minute to 1 month. The timescale I use varies massively depending on whether I'm just having a general look or day trading a coin.
By default, the bar style will be set to candles. I mentioned this briefly in my last thread, but here's a quick overview of what a candlestick line is:

You can change the bar style to a range of others by clicking the drop-down next to the candle image. To the right of that, you have the main chart properties. Here you can change everything from the styling to the scaling.
If you would like to compare the price of a coin across multiple exchanges, or even with a completely separate asset, you can do so by selecting the compare button and then repeating the process of opening a chart.

The toolbar on the left has a number of tools that allow you to draw on the chart, for analysing trends etc. If you're reading this thread then the chances are that you won't want to mess with that.
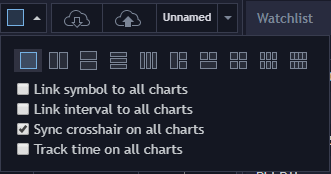
The free version of Tradingview only allows you to view a single chart in a tab, however, an easy workaround for that is just opening multiple tabs and having one chart in each. It may get a little cramped if you're using multiple screens, but I have a few big monitors and it looks fine. (Or see the tip at the bottom of the next section)
Exchange Charts:
Using Tradingview is fine, but if you suddenly need to make a trade you may have lost out by the time you sign in and find the market you want to trade on. A simple way to get around this is to monitor the price of a coin directly on the exchange. As well as showing the typical charting information, you can now quickly place a buy/ sell order, ensuring that you never miss out.
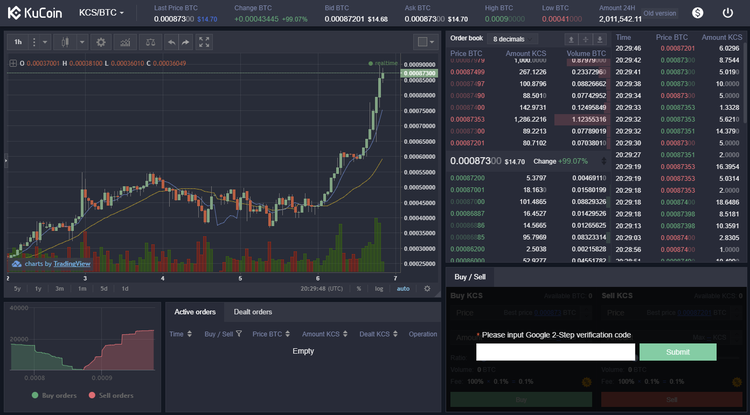
Kucoin actually uses Tradingview to display the charts and you can access paid features, such as having multiple charts on a tab, for free.
Portfolio Trackers
So far I've explained how I monitor the price of cryptocurrencies, but how do you actually keep track of your portfolio, if it's split across a number of exchanges and accounts?
The easiest way is to register an account on a portfolio-tracking website. Here you can enter all trades you made & accurately track profit/loss. There's not a specific web-based tracker I would recommend, so here's a few I found on Google:
If you know how to code I would recommend creating your own tracker, using Coinmarketcap/ your favourite exchange's API as it will save you a lot of headache down the line. Maybe I'll save that for another thread.
That's it!
You should (Hopefully) now know more about tracking the price of Cryptocurrencies.
As always, please don't ask for/ offer any investing advice here. This is a guide for people who are new to Cryptocurrencies and I would like to keep it that way, thanks. Check the forum's Cryptocurrency Section Rules before posting a thread, please.
Hands down, the best place to start out is Coinmarketcap.com. They're the biggest price-tracking platform out there, supporting 1384 cryptos at the time of writing this. From the home screen, you can view the top one hundred coins, sorted by market cap. You also have the ability to sort them by price, volume, circulating supply, 24hour percentage change.
After navigating to a specific crypto (click the name) you can then view pretty much all of the relevant information, from the official website(s) to the historical price changes and even social media feeds.
Having all of the lines enabled on the price graph can often be annoying, so you may want to disable some. Simply click on the colourized options to disable them and the grey ones to enable them again.
While we're on the topic of price, it's almost always a good idea to look at/calculate the price in BTC and not USD. Not only is this more accurate, as it doesn't rely on multiple currency conversion, but it's also important to know your profit % in Bitcoin as well as USD otherwise your portfolio could be increasing in fiat value, but decreasing in BTC. (Not relevant for the above image, as it was the Bitcoin chart)
They calculate the price based on a weighted-average from all of the exchanges trading the coin (Meaning the price on exchanges with higher volumes has a bigger influence on the overall price) and you can get a (slightly outdated) price for a specific exchange by navigating to the "markets" tab.
The only negative thing about CoinMarketCap is that they (currently) don't offer any sort of personalized view. If you're really into crypto, like me, you may want to create a customized dashboard using their HTML widgets. This is really easy to do and you don't even need to purchase a domain (unless you want to view it externally).
(example)
Open up Notepad ++/ your text editor of choice, and then copy the below code in:
Then, for every coin you want to see, head over to the "Tools" tab on Coinmarketcap. For example, Bitcoin's would be https://coinmarketcap.com/currencies/bitcoin/#tools.
You should then see a text box containing the HTML widget with a preview of what it looks like. If you want to change anything (What currency is shown etc) you can customize the widget using the blue button.

Copy the whole text and then paste it in between the <div class="column"> and <div> tags. For exampe:
Repeat the process for as many cryptos as you want to track, each time adding a new <div class="column"><div> with the code from CMC in between the tags. The higher up in the file the <div> is, the higher it will show on the page.
If you used the code I suggested at the start, you should see three columns of coins. If you want to change this just replace the below percentage with the number that you want. For example, 25% would show four columns, 20% would show five etc.

You can now double-click the .HTML file and view it in the browser of your choice. If you want to be able to view this from another device, just upload it to the public_html folder of your host and then navigate to yourdomain.com/crypto.html
Code:
<!DOCTYPE html>
<div class="row">

<style>
.column {
    float: left;
    width: 33.33%;
}

/* Clear floats after the columns */
.row:after {
    content: "";
    display: table;
    clear: both;
}

</style>

  <div class="column"><div>
  <div class="column"><div>
  <div class="column"><div>

</div>You should then see a text box containing the HTML widget with a preview of what it looks like. If you want to change anything (What currency is shown etc) you can customize the widget using the blue button.
Copy the whole text and then paste it in between the <div class="column"> and <div> tags. For exampe:
Code:
<div class="column">

  <script type="text/javascript" src="https://files.coinmarketcap.com/static/widget/currency.js"></script>
<div class="coinmarketcap-currency-widget" data-currency="bitcoin" data-base="USD" ></div>

<div>If you used the code I suggested at the start, you should see three columns of coins. If you want to change this just replace the below percentage with the number that you want. For example, 25% would show four columns, 20% would show five etc.
You can then save the file. Make sure you have selected "Save as type: All types(*.*)" and then name it something like crypto.html.<style>
.column {
float: left;
width: 33.33%;
You can now double-click the .HTML file and view it in the browser of your choice. If you want to be able to view this from another device, just upload it to the public_html folder of your host and then navigate to yourdomain.com/crypto.html
Alternatively, you can install the CoinMarketCap Enhanced Chrome Extension, which offers some nice features over the standard version, but is exclusive to chrome.
The charts page has some really interesting graphs that are a good idea to look at, such as the market dominance graph.
Trading View:
For those of you who want to get a bit more technical and view more accurate prices, Tradingview.com/chart/ is a great place to look.
By default, it will probably load in Apple's share price. You can change this to a cryptocurrency of your choosing by searching for the symbol in the top-left box. You will probably notice that there are multiple results for each crypto. This is because they allow you to pick (for some coins) the currency you would like to compare it to. For example, NEOBTC is the NEO price in BTC.
You may also notice that there are multiple charts for NEOBTC. This is because trading view allows you to view the price on specific exchanges. This is one of the main reasons I use Trading view, as it allows me to view the price on the exchange I have that specific coin on, yet quickly view another coin on a separate exchange.
You can keep track of multiple coins while viewing a specific chart by adding them to your watchlist in the top-right of the screen.
Coming back to the top toolbar, there are a few more options that you may find useful. Clicking on the time will allow you to change the chart intervals, anywhere from 1 minute to 1 month. The timescale I use varies massively depending on whether I'm just having a general look or day trading a coin.
By default, the bar style will be set to candles. I mentioned this briefly in my last thread, but here's a quick overview of what a candlestick line is:
You can change the bar style to a range of others by clicking the drop-down next to the candle image. To the right of that, you have the main chart properties. Here you can change everything from the styling to the scaling.
If you would like to compare the price of a coin across multiple exchanges, or even with a completely separate asset, you can do so by selecting the compare button and then repeating the process of opening a chart.
The toolbar on the left has a number of tools that allow you to draw on the chart, for analysing trends etc. If you're reading this thread then the chances are that you won't want to mess with that.
The free version of Tradingview only allows you to view a single chart in a tab, however, an easy workaround for that is just opening multiple tabs and having one chart in each. It may get a little cramped if you're using multiple screens, but I have a few big monitors and it looks fine. (Or see the tip at the bottom of the next section)
Exchange Charts:
Using Tradingview is fine, but if you suddenly need to make a trade you may have lost out by the time you sign in and find the market you want to trade on. A simple way to get around this is to monitor the price of a coin directly on the exchange. As well as showing the typical charting information, you can now quickly place a buy/ sell order, ensuring that you never miss out.
Kucoin actually uses Tradingview to display the charts and you can access paid features, such as having multiple charts on a tab, for free.
Portfolio Trackers
So far I've explained how I monitor the price of cryptocurrencies, but how do you actually keep track of your portfolio, if it's split across a number of exchanges and accounts?
The easiest way is to register an account on a portfolio-tracking website. Here you can enter all trades you made & accurately track profit/loss. There's not a specific web-based tracker I would recommend, so here's a few I found on Google:
- Cryptocompare
- Altpocket
- Coin.fyi
- CoinTracking.info
- CoinTrackr - (Recently sold on Flippa)
If you know how to code I would recommend creating your own tracker, using Coinmarketcap/ your favourite exchange's API as it will save you a lot of headache down the line. Maybe I'll save that for another thread.
That's it!
You should (Hopefully) now know more about tracking the price of Cryptocurrencies.
As always, please don't ask for/ offer any investing advice here. This is a guide for people who are new to Cryptocurrencies and I would like to keep it that way, thanks. Check the forum's Cryptocurrency Section Rules before posting a thread, please.


