- Nov 29, 2022
- 2,481
- 284

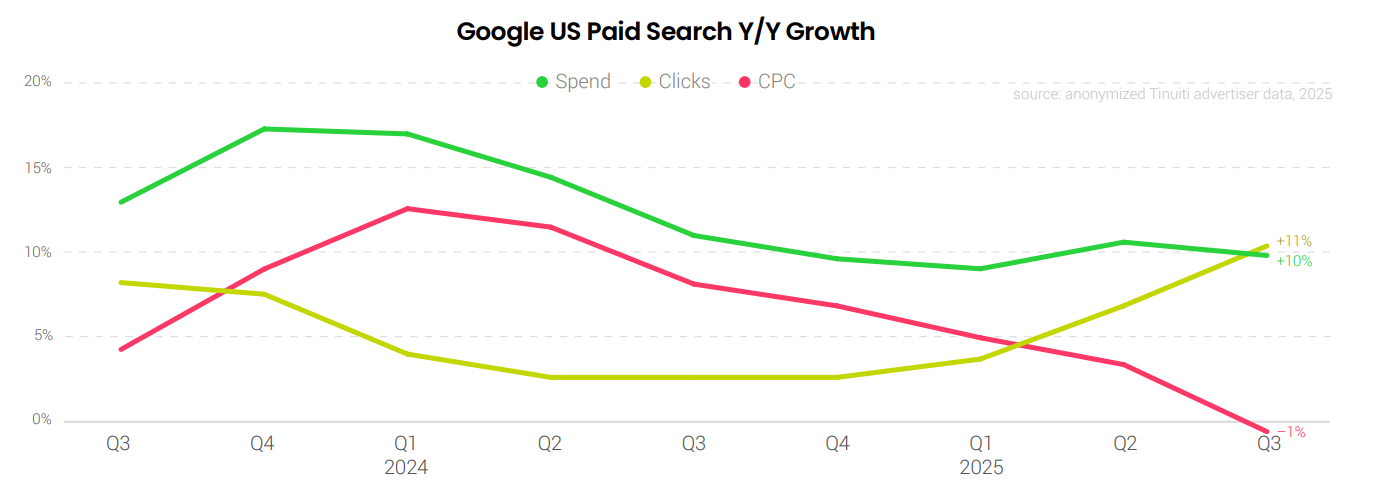
Digital Ads Benchmark, based on anonymized data from U.S. advertising campaigns with more than $4B in annual spend, reported that Google search ad spend rose 10% year over year in Q3 2025. Click growth accelerated to 11%, while cost per click (CPC) declined by 1%. The key development of the quarter was Amazon’s July exit from U.S. shopping auctions, which reduced competitive pressure on CPC and helped drive additional traffic to other retailers.
Search Advertising
- Advertiser spend on Google paid search increased 10% year over year in Q3 2025, which is 1 percentage point lower than in Q2.
- Click growth accelerated for the fifth consecutive quarter, reaching 11%. At the same time, average CPC fell 1%—its first decline in two years.
Google Shopping Campaigns
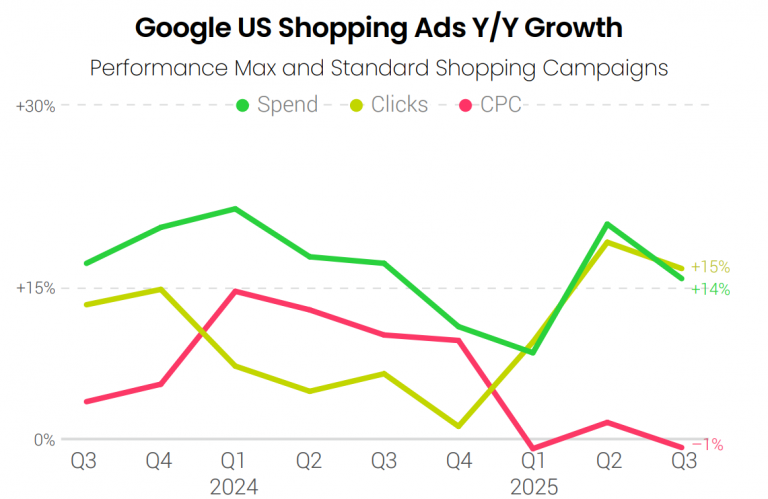
- Spend on Google Shopping ads increased 14% year over year in Q3 2025.
- Clicks rose 15%, and CPC decreased by 1%.
Performance Max (PMax)
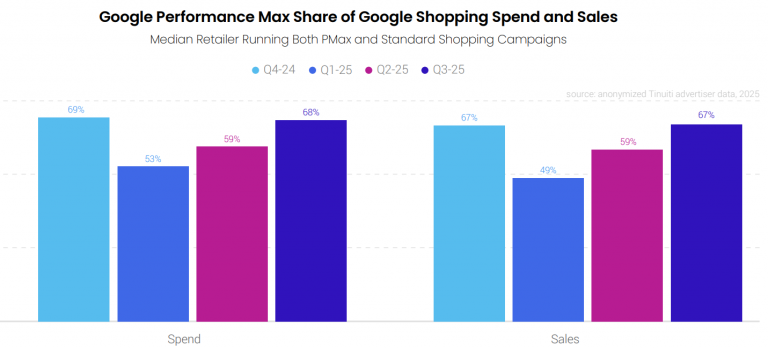
- Among advertisers running both formats, there is a clear shift of budgets back toward Performance Max after a dip earlier in the year.
- In Q3 2025, Performance Max represented 68% of Google Shopping spend, up from 59% in Q2 and 53% in Q1.
- PMax generated 67% of total Shopping-attributed sales in Q3.
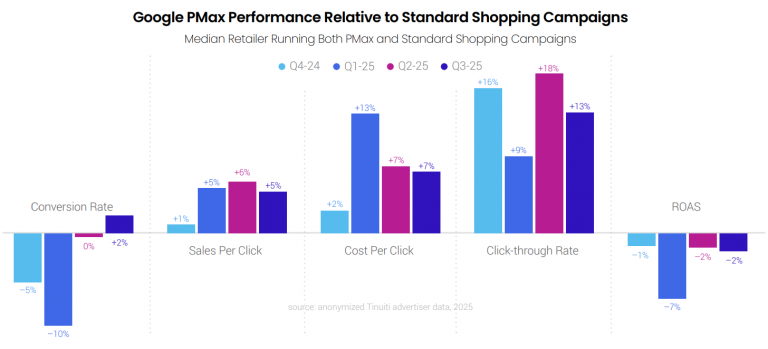
- In Q3 2025, Performance Max delivered results 2% higher than standard Shopping campaigns. This is a meaningful improvement, given that PMax underperformed by 10% in Q1.
- PMax produced 5% more sales per click than standard Shopping; however, because CPC was 7% higher, return on ad spend (ROAS) for PMax was 2% lower.
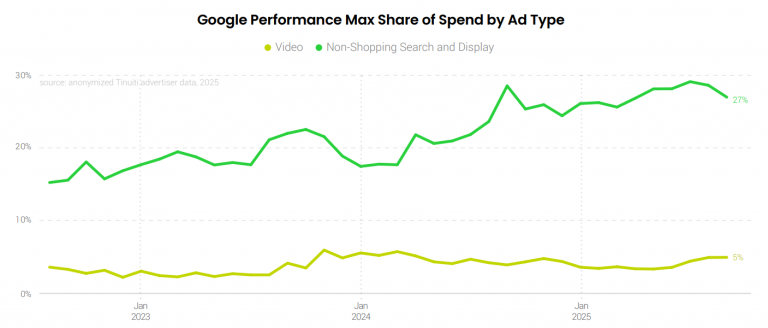
- By the end of Q3, spend on non-Shopping PMax campaigns reached 27% of total spend among retail advertisers.
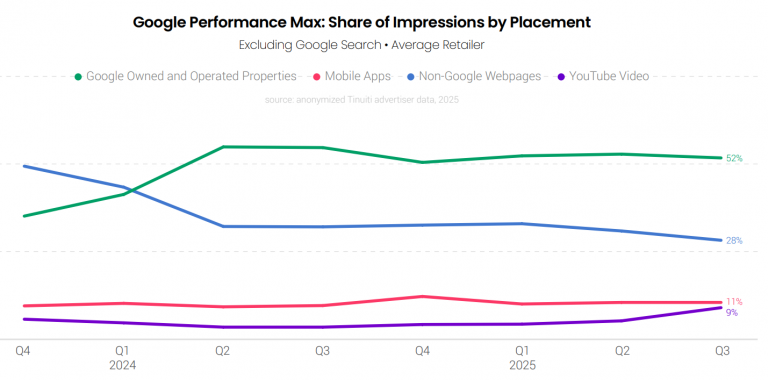
- The share of non-search PMax impressions delivered through YouTube video increased from 5% in Q2 to 9% in Q3 2025.
- Most Performance Max impressions still come from Google-owned and Google-operated inventory (Search, Shopping, Gmail, Discover, etc.).
- The share of impressions served on non-Google websites continues to decline. This trend intensified after Google introduced account-level placement exclusions for the Search Partner Network—advertisers are actively using this feature to improve traffic control.
Text Ads
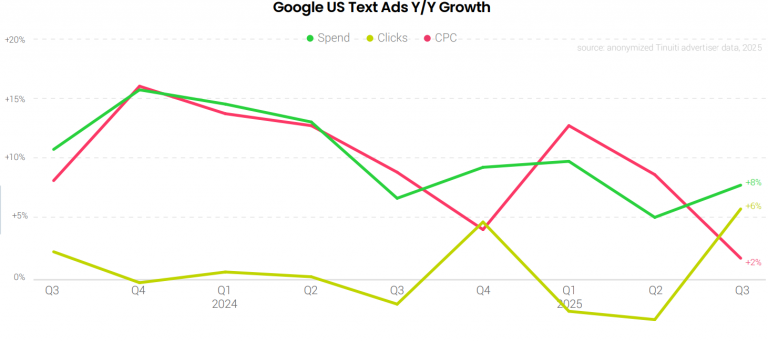
- Spend on text ads in Search increased 8% year over year, up from 5% growth in Q2.
- Click volume increased for the first time since Q4 2024.
- CPC growth has slowed after a 13% peak in Q1, driven by higher costs on branded keywords.
- AI Max campaigns are being tested as an add-on, but their contribution to overall growth remains minimal.
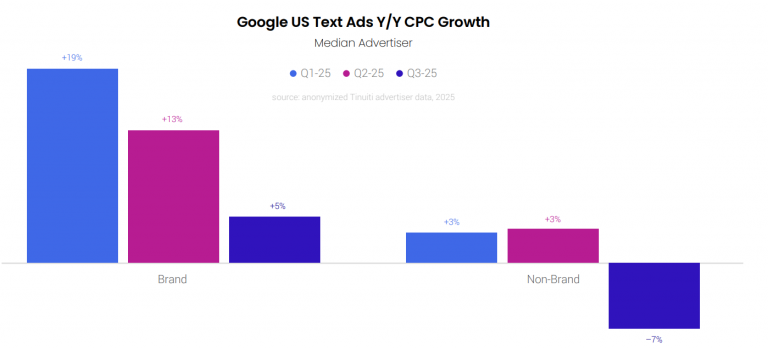
- After a sharp 19% year-over-year spike in branded CPC in Q1, growth decelerated significantly: the slowdown continued in Q2 and Q3, with branded CPC up just 5% in Q3.
- For non-branded queries, CPC rose modestly earlier in the year (+3% in Q1 and Q2), but declined 7% in Q3.
Video and Display Network
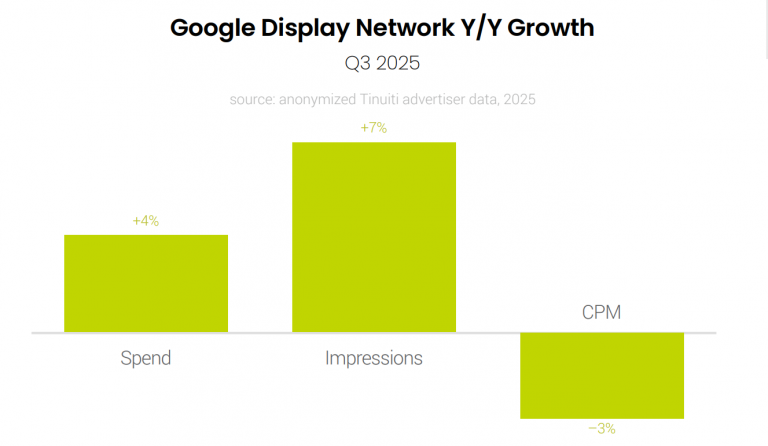
- Spend on Google Display Network (including display, apps, Demand Gen, video, and other formats) increased 4% year over year, down from 6% growth in Q2.
- Impressions: +7% year over year. Average CPM: -3% year over year.
- Google’s “Other” advertising revenue segment (excluding Search and YouTube) has recorded revenue declines for 12 consecutive quarters.