Forecasting Bitcoin, Litecoin and Ethereum
In recent months millions of people have entered the crypto space and diversified their portfolio by investing in different coins. Only a small percentage have made a nice profit, while most lost a major chunk of their investment. Some have even sold their household items, their car or taken on a loan to invest in crypto. These are all somewhat reckless decisions, unless the person had it all planned out — but 99% didn’t.
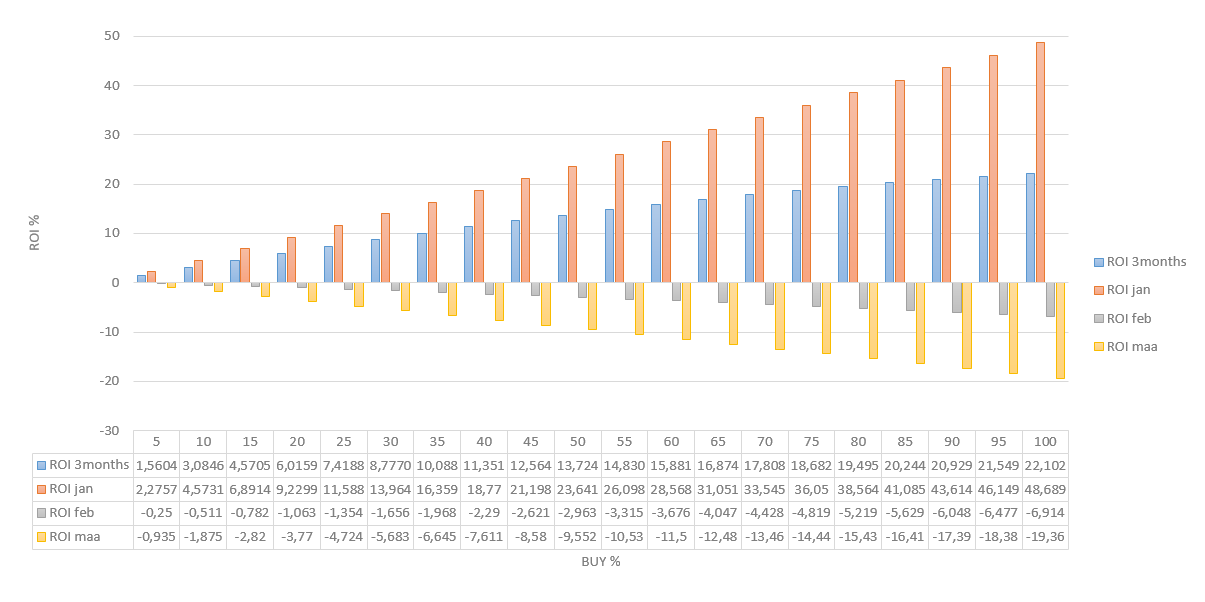
If only these people had more knowledge then they would have made better decisions. Instead of losing over -30% of their investment, they could’ve easily made over +40%. Unfortunately nobody can look into the future, except if the market is rigged and/or influenced by insider trading.
However, technology does allow us to
make short-term predictions of where the price might go. This wouldn’t be possible without the latest techniques and innovations in machine learning algorithms and artificial intelligence systems. So making short-term predictions for Bitcoin, Litecoin and Ethereum is on today’s menu, but first some development news.
What we’ve been cooking
About three weeks ago we have decided to focus our efforts primarily on developing a brand new mobile app. Our current app (which you can find on the Google Play store) is limited to Android devices, so to cope with the cross-platform ideology we shall develop a web based app that works on any platform as long as there is an up-to-date web browser, e.g. Firefox, Chrome, etc.
In a week or two we shall release a roadmap/timeline of all the features we plan on integrating. These new features will go far beyond just making price predictions. But we will remain true to our core, which is providing only the most necessary tools & features to crypto investors and traders. No matter what your skill level is, beginner or expert, we’ll make sure you have all the tools you need to be more successful.
Improving in-app predictons
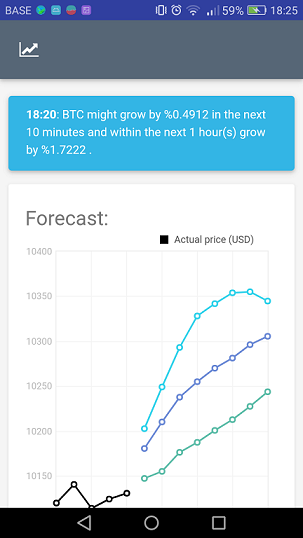
If you have been using our current app, then you know that the predictions are generated only every 10 minutes (or 60 minutes for hourly intervals). This is so because of technical reasons. But we have made new progress and figured out how to improve our system to generate a new set of predictions every single minute. However we do not plan on going going smaller than a minute anytime soon, unless there is a specific purpose and reason behind it.
Another thing that has been bothering me is that the charts aren’t always refreshed automatically. We want our data and predictions to be displayed in a real-time fashion just like on an exchange. But since we are not an exchange per se, we don’t want to induce a lot of unnecessary overhead and network traffic by pushing updates every second or so. Instead we have opted for pushing price & prediction updates every ten seconds, with the ability to disable/enable real-time updates.
Anomaly detection
Some of our users have complained that they’ve been receiving push notifications too frequently. This is an issue we are tackling right now — we want to make sure you receive only the most crucial notifications, without missing out on important events. The entire AD system will have a full rework.
Forecasting
Apart from developing the app itself, we have made some really nice progress on our crypto predictions system. In what follows I am going to evaluate the performance of our system on three markets: BTC, ETH and LTC. The data stems from the Binance exchange, if you care to know. But which data exactly, and how it was used to generate these predictions will remain a secrecy.
Note: in what follows, we are going to evaluate the generated predictions against the actual data. To do that we have to look at past intervals. All data and dates used were captured in the past 48 hours.
Ethereum
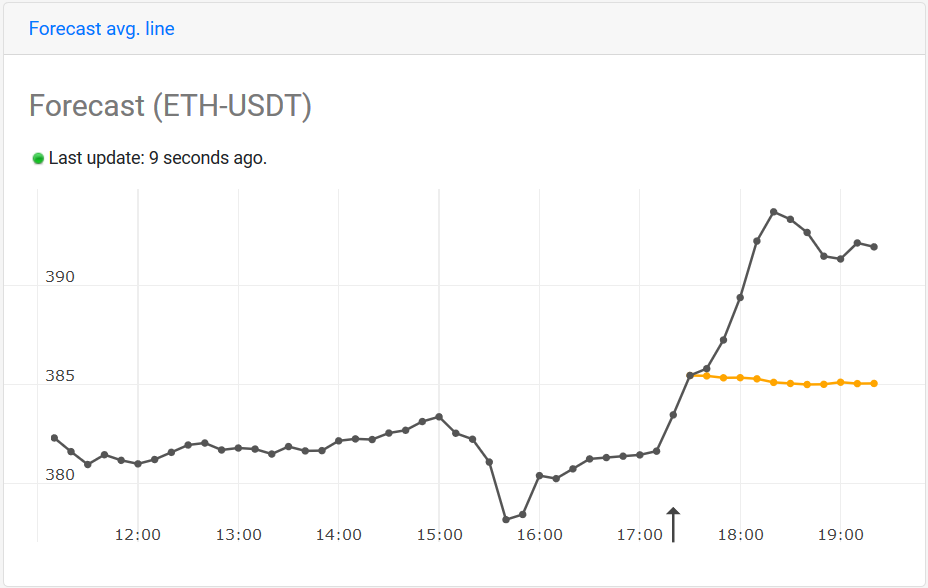
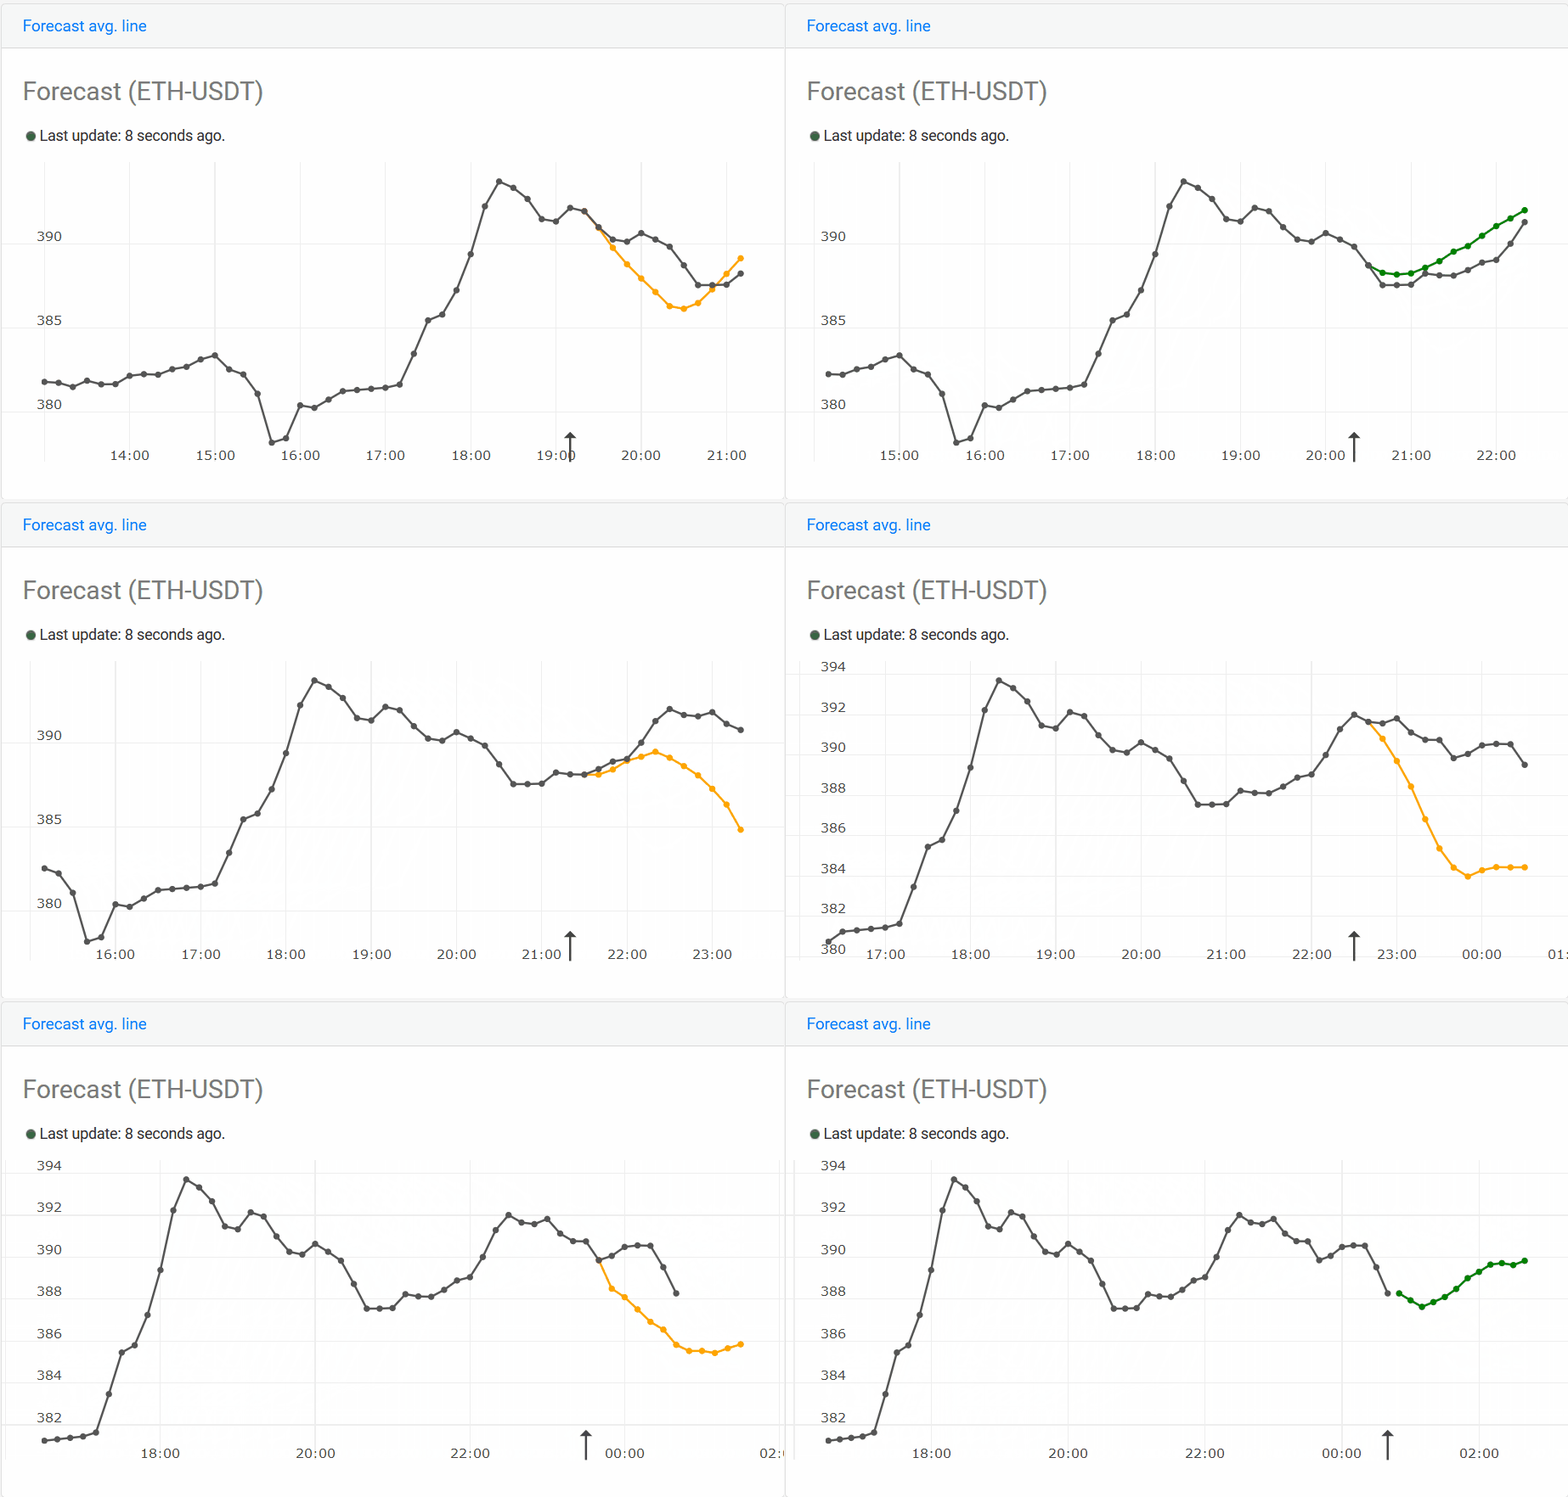
In almost all our previous blog posts we have been evaluating Bitcoin (BTC), so today we are going to add Ethereum and Litecoin into the mix as well. Let’s start we the following chart of Etherum, it’s derived from 10 minute candlesticks:
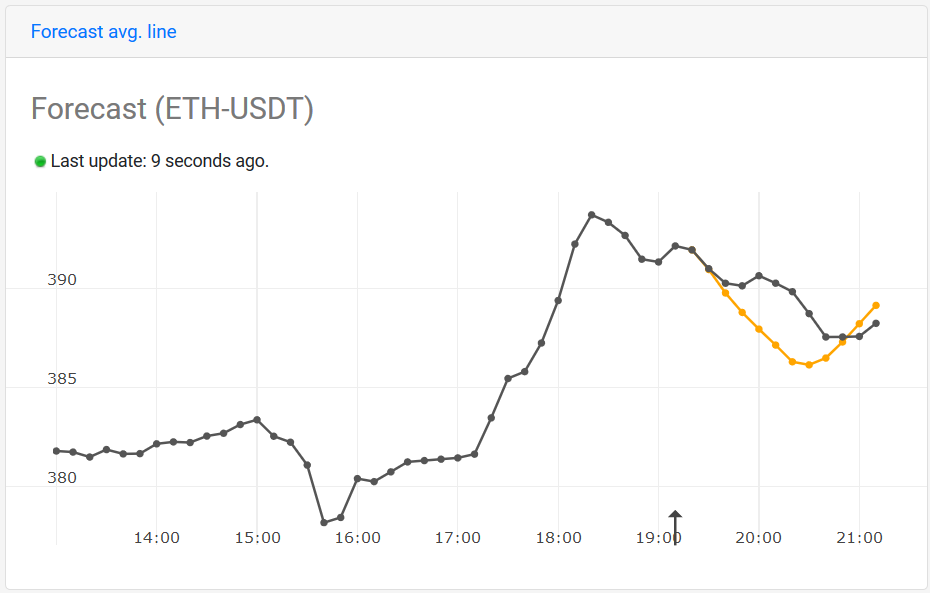
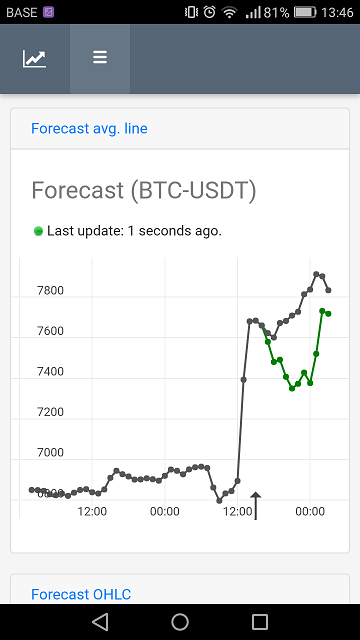
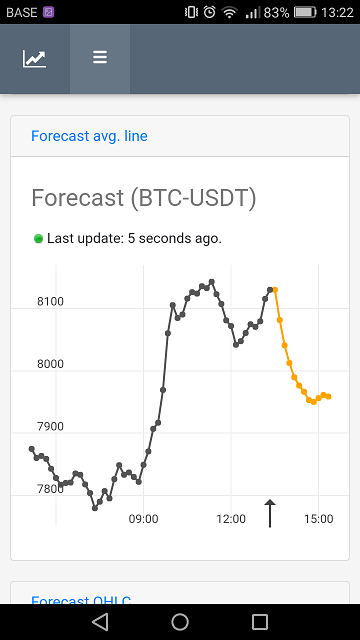
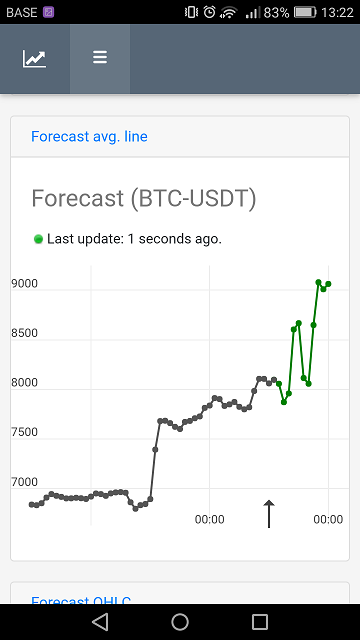
The black line is the actual price (average of Open/Low/High/Close values) — the orange (or green) line represents the predictions. The arrow indicates at what specific time/interval this prediction was generated. So the prediction was generated based solely on data until the arrow (so it’s not “over-fitted” in machine learning terms). In this case the prediction is not accurate at all. It shows that the price will stabilize after rapid price increase. And there is some logic behind it — the system may have learned that after such an event there is usually a period of stability, so that’s why it’s indicating just that.
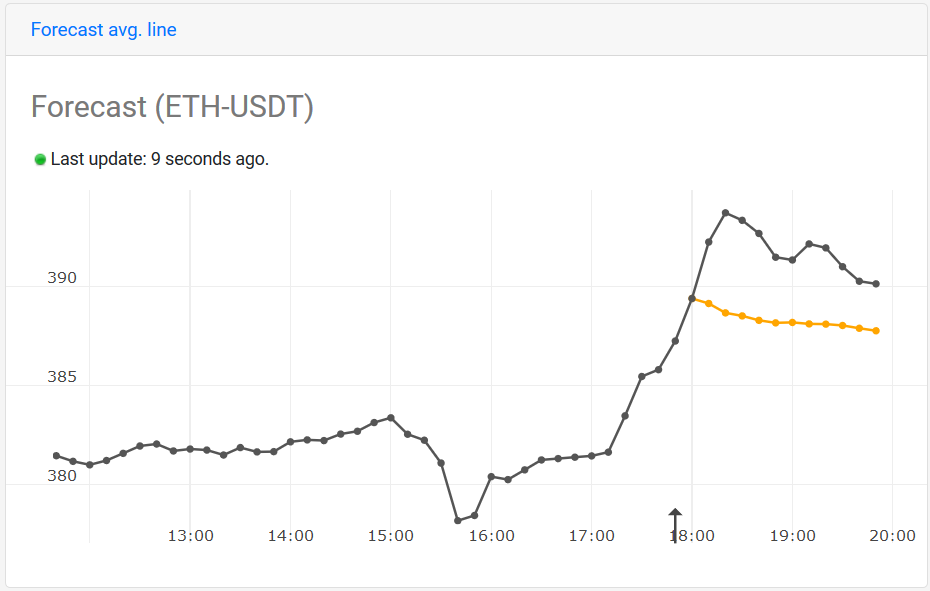
Now let’s step ahead a couple of intervals, but we still see that it showing a period of stability. This may seem odd, but I still hold on to my previous statement — it’s expect the price to start stabilizing soon. By comparing it against what really happened, the price didn’t stabilize but went up even more.
On first sight these predictions seem to be inaccurate, that is only if we interpret them in absolute terms. They do however become more apparent and meaningful when you look at them as “forecasts” — this means that there is a high probability “some” event is going to happen soon, but we don’t know “when”. Our prediction system cannot predict “when” something will happen, but it does a really good job at telling us what the “some event” might be. There are several good reasons why this is so — without explaining every single one of them, it is that the market is pushed/influenced by external factors (i.e. people/traders), and since people’s decisions are pretty much unpredictable, so is the “when” factor as unpredictable.
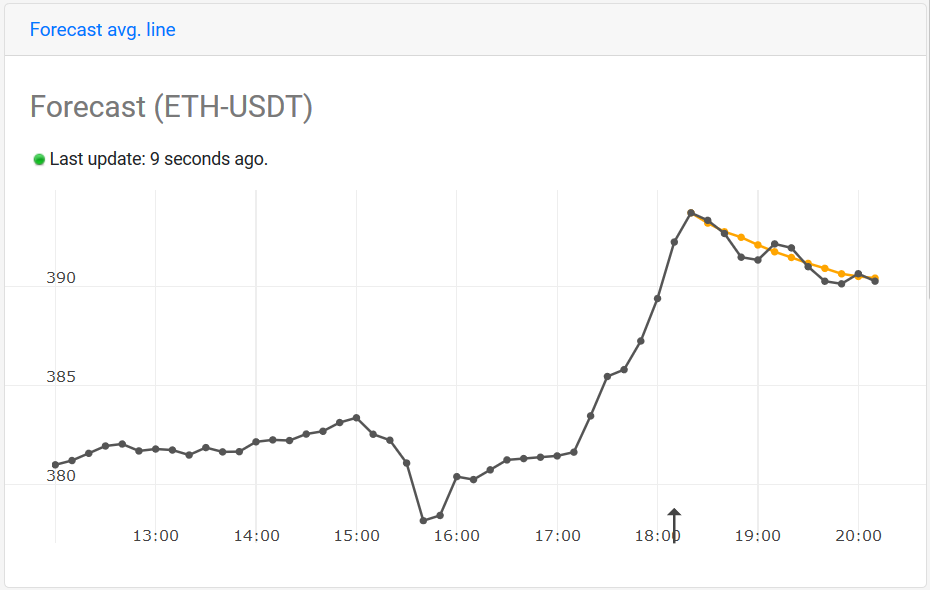
Let’s step ahead to the highest point on the chart and see what the predictions tell us:
From the above we clearly see that the predictions are finally in harmony with our reality. They have finally reached their optimal state, such that the “some predicted event” has began to manifest.
Stepping ahead 50 minutes (5 intervals) ahead we see some new interesting pattern:
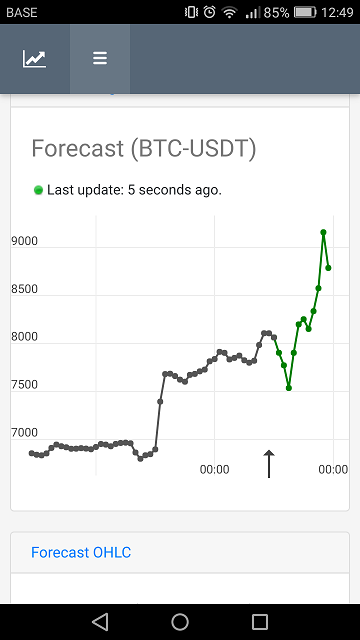
In the above, the system is forecasting the price to go down in a linear fashion until it reaches a certain point and then goes up again. The reality wasn’t that far off, but it did it in a slightly different fashion.
Throughout my experiments and analyses, I was always stunned by how well the system adapts to minor changes. Here’s what I mean… have a look at the chart below:
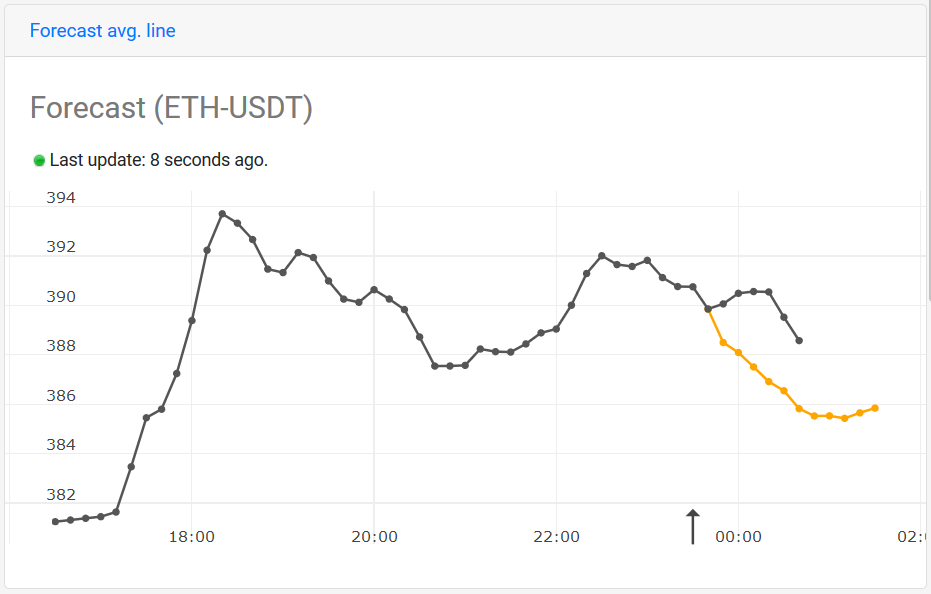
At this interval the predictions indicate a strict decline. Now let us go to the next interval, where the system has corrected itself and generated a new prediction:
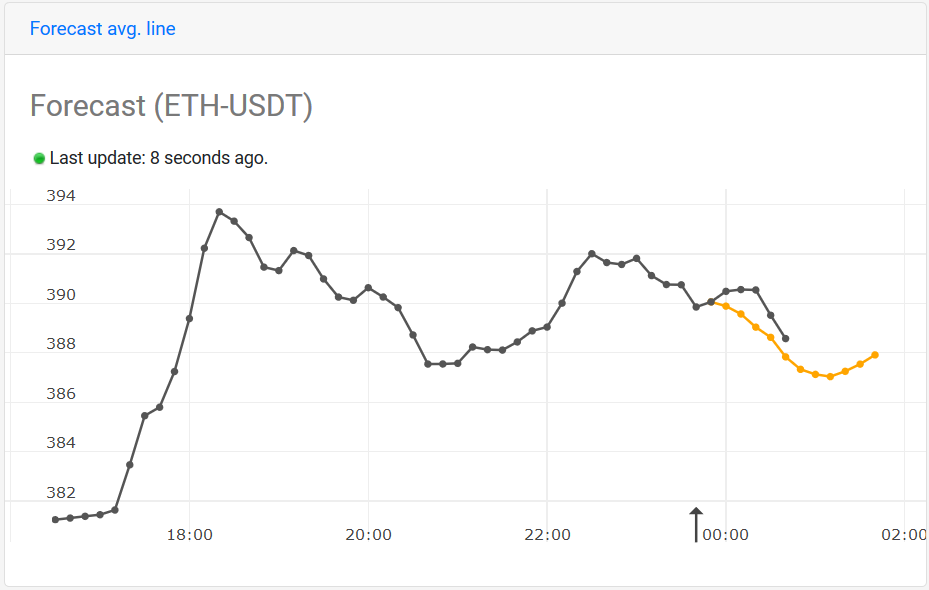
The above looks way better now doesn’t it? It learned that the price didn’t go down even further as it initially predicted, so it readjusted/adapted itself in a clever way.
Litecoin
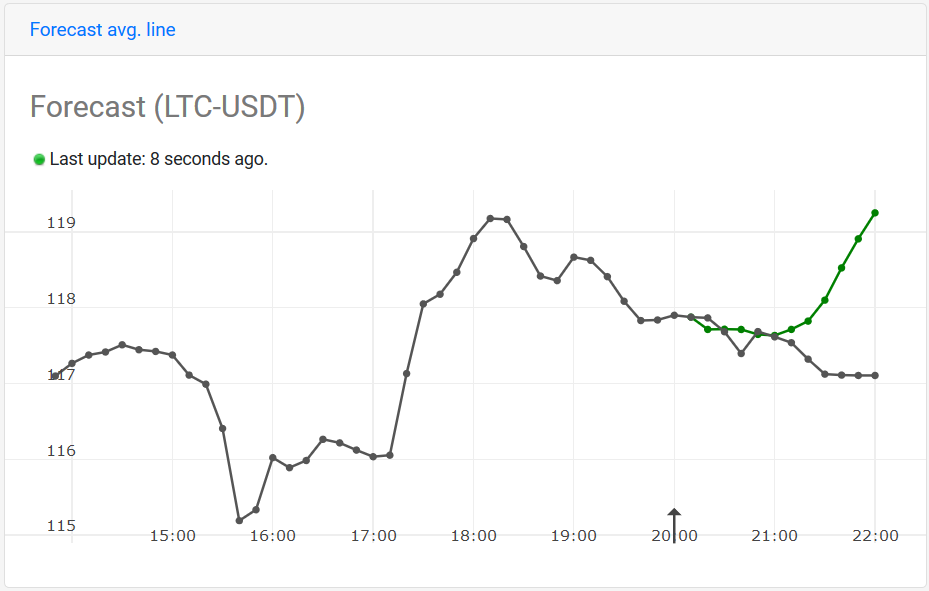
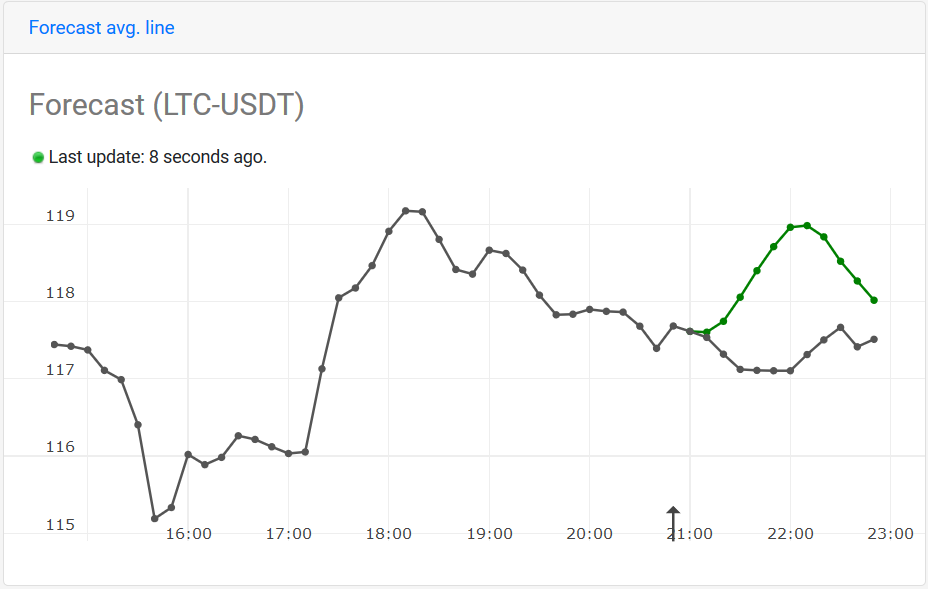
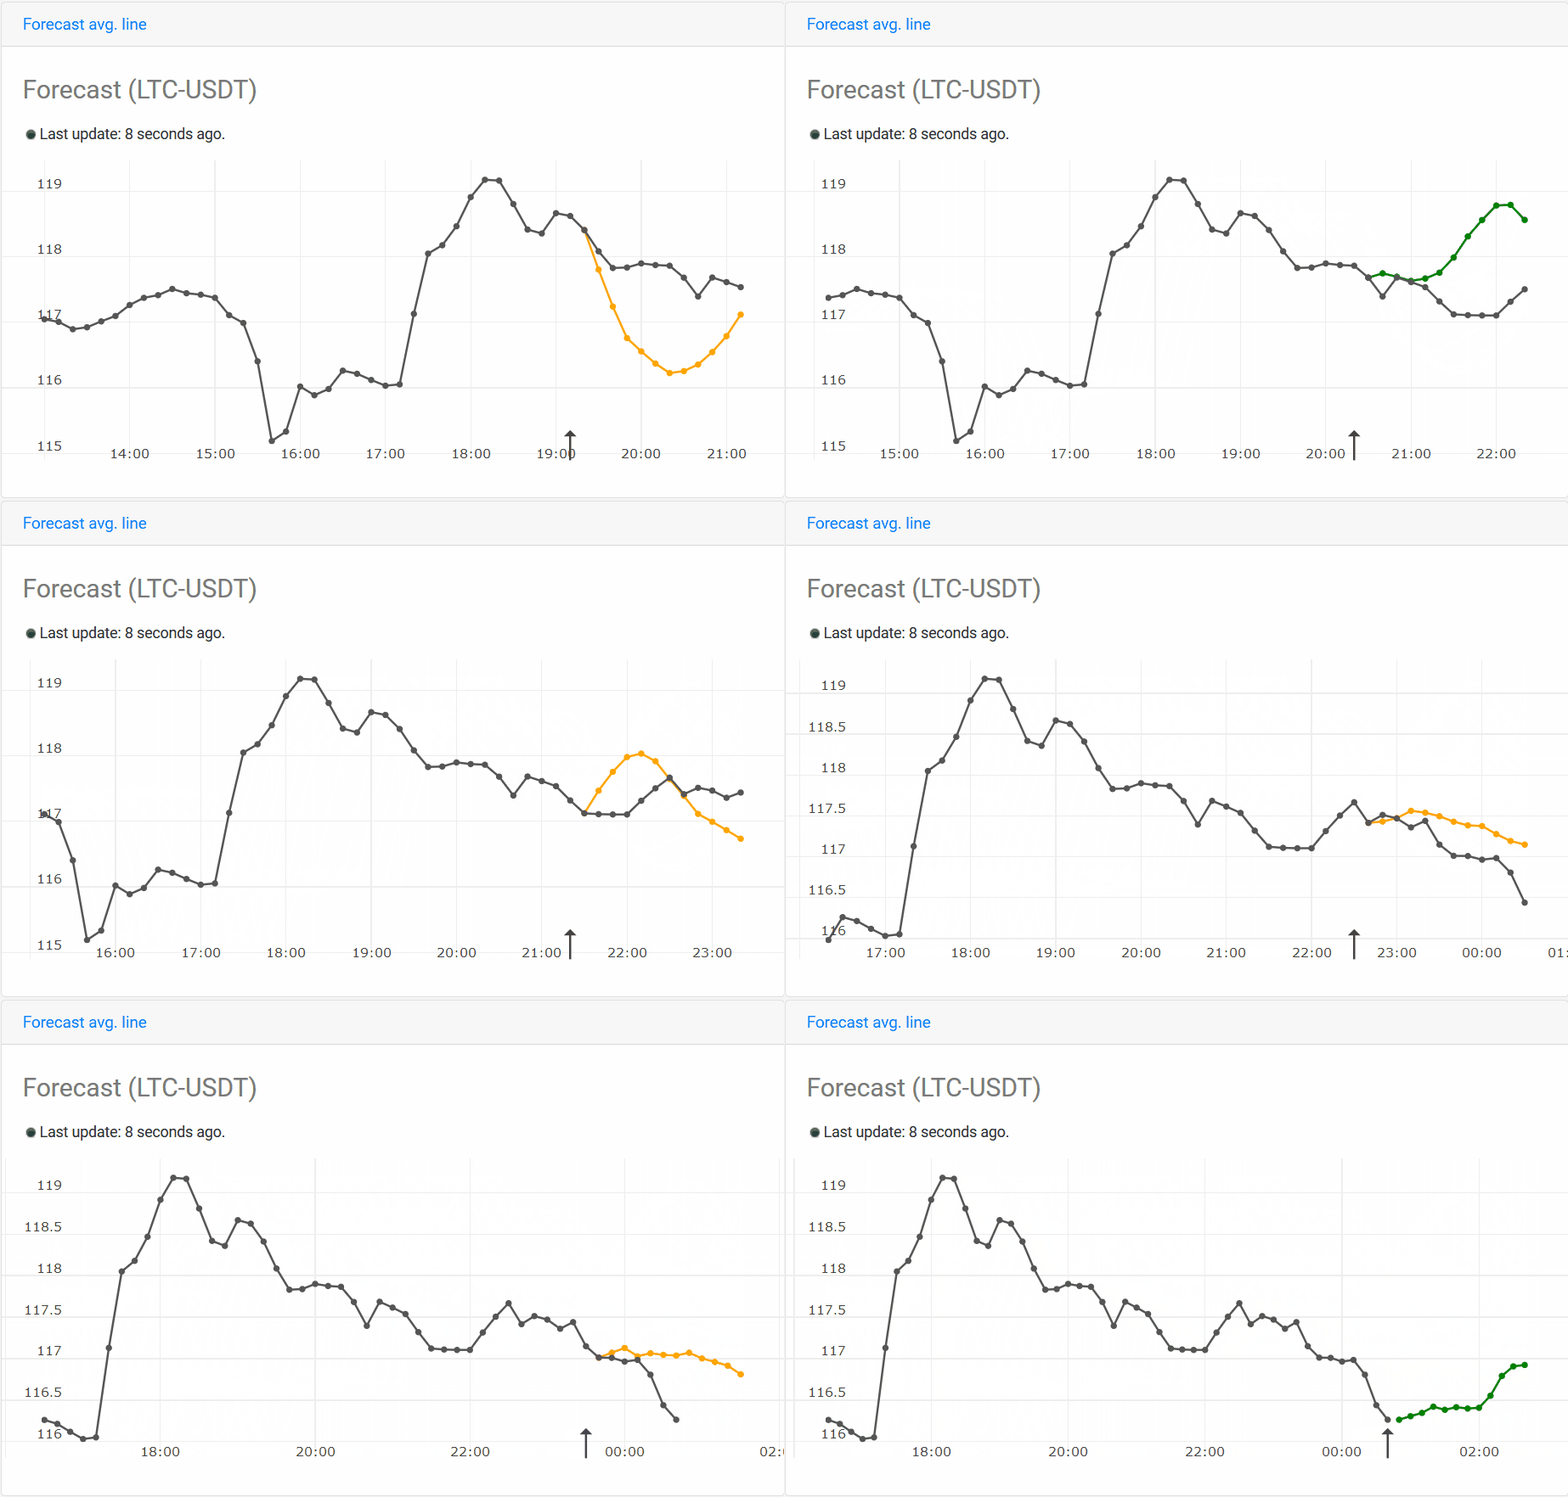
In the case of Ethereum I have shown how well the system can predict near-future events and adapt itself to new events. But it doesn’t always work out that great. In some cases it’s predicting utopian events:
In the above it shows that the price will remain stable more or less until 21:00 and then shoot up — this did not happen in reality, but definitely a nice attempt nonetheless.
As I kept stepping through the intervals, the system remained very persistent, it kept predicting that the price would go up after 21:00 — you can clearly see its relentless guts on this chart:
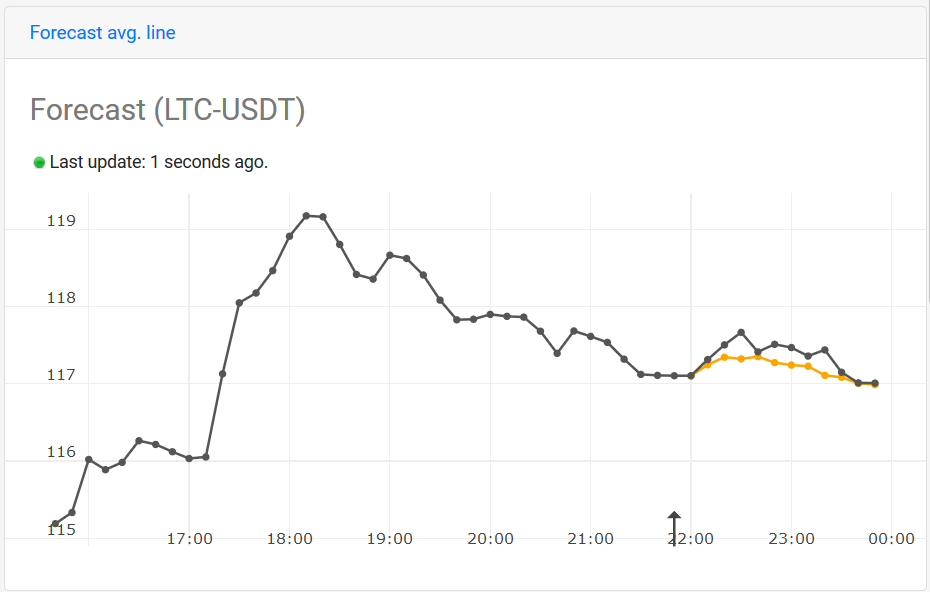
There was no increase in ETH’s price as indicated by these predictions, at least not until 22:30 as you can see on the next chart. But even then, this increase was much lower than predicted on the chart above. However, we again see the power of an AI system, which has learned/adapted and eventually made a much more accurate prediction:
Bitcoin
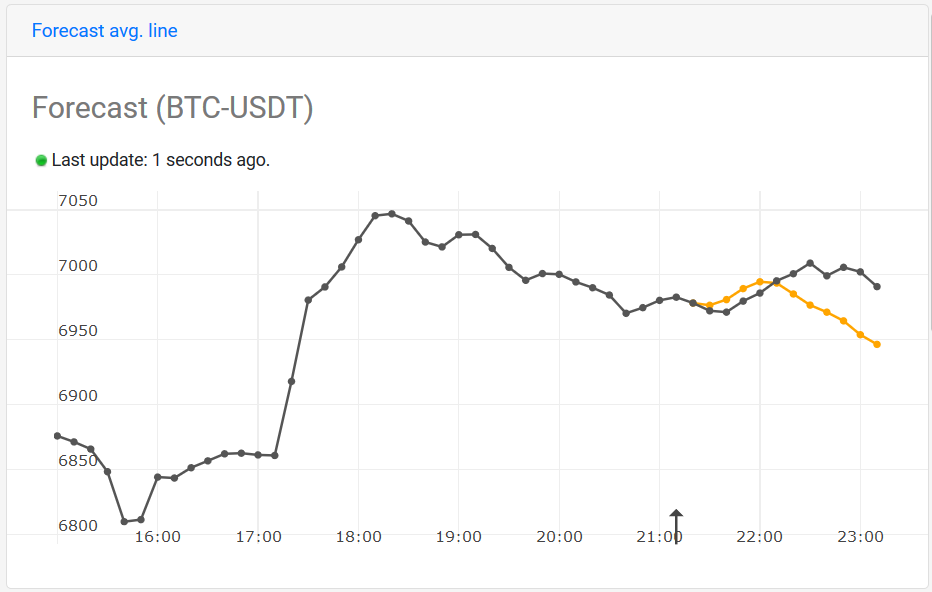
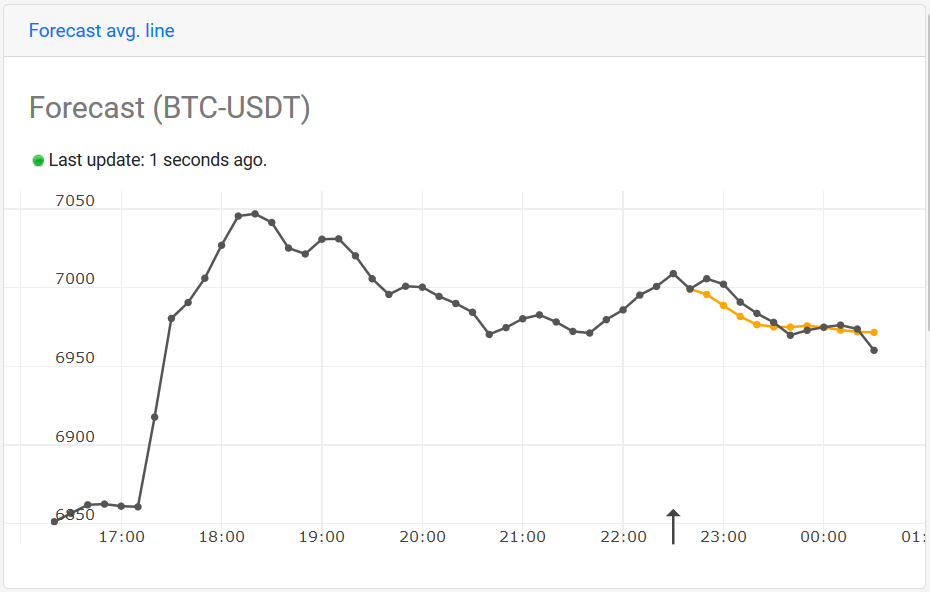
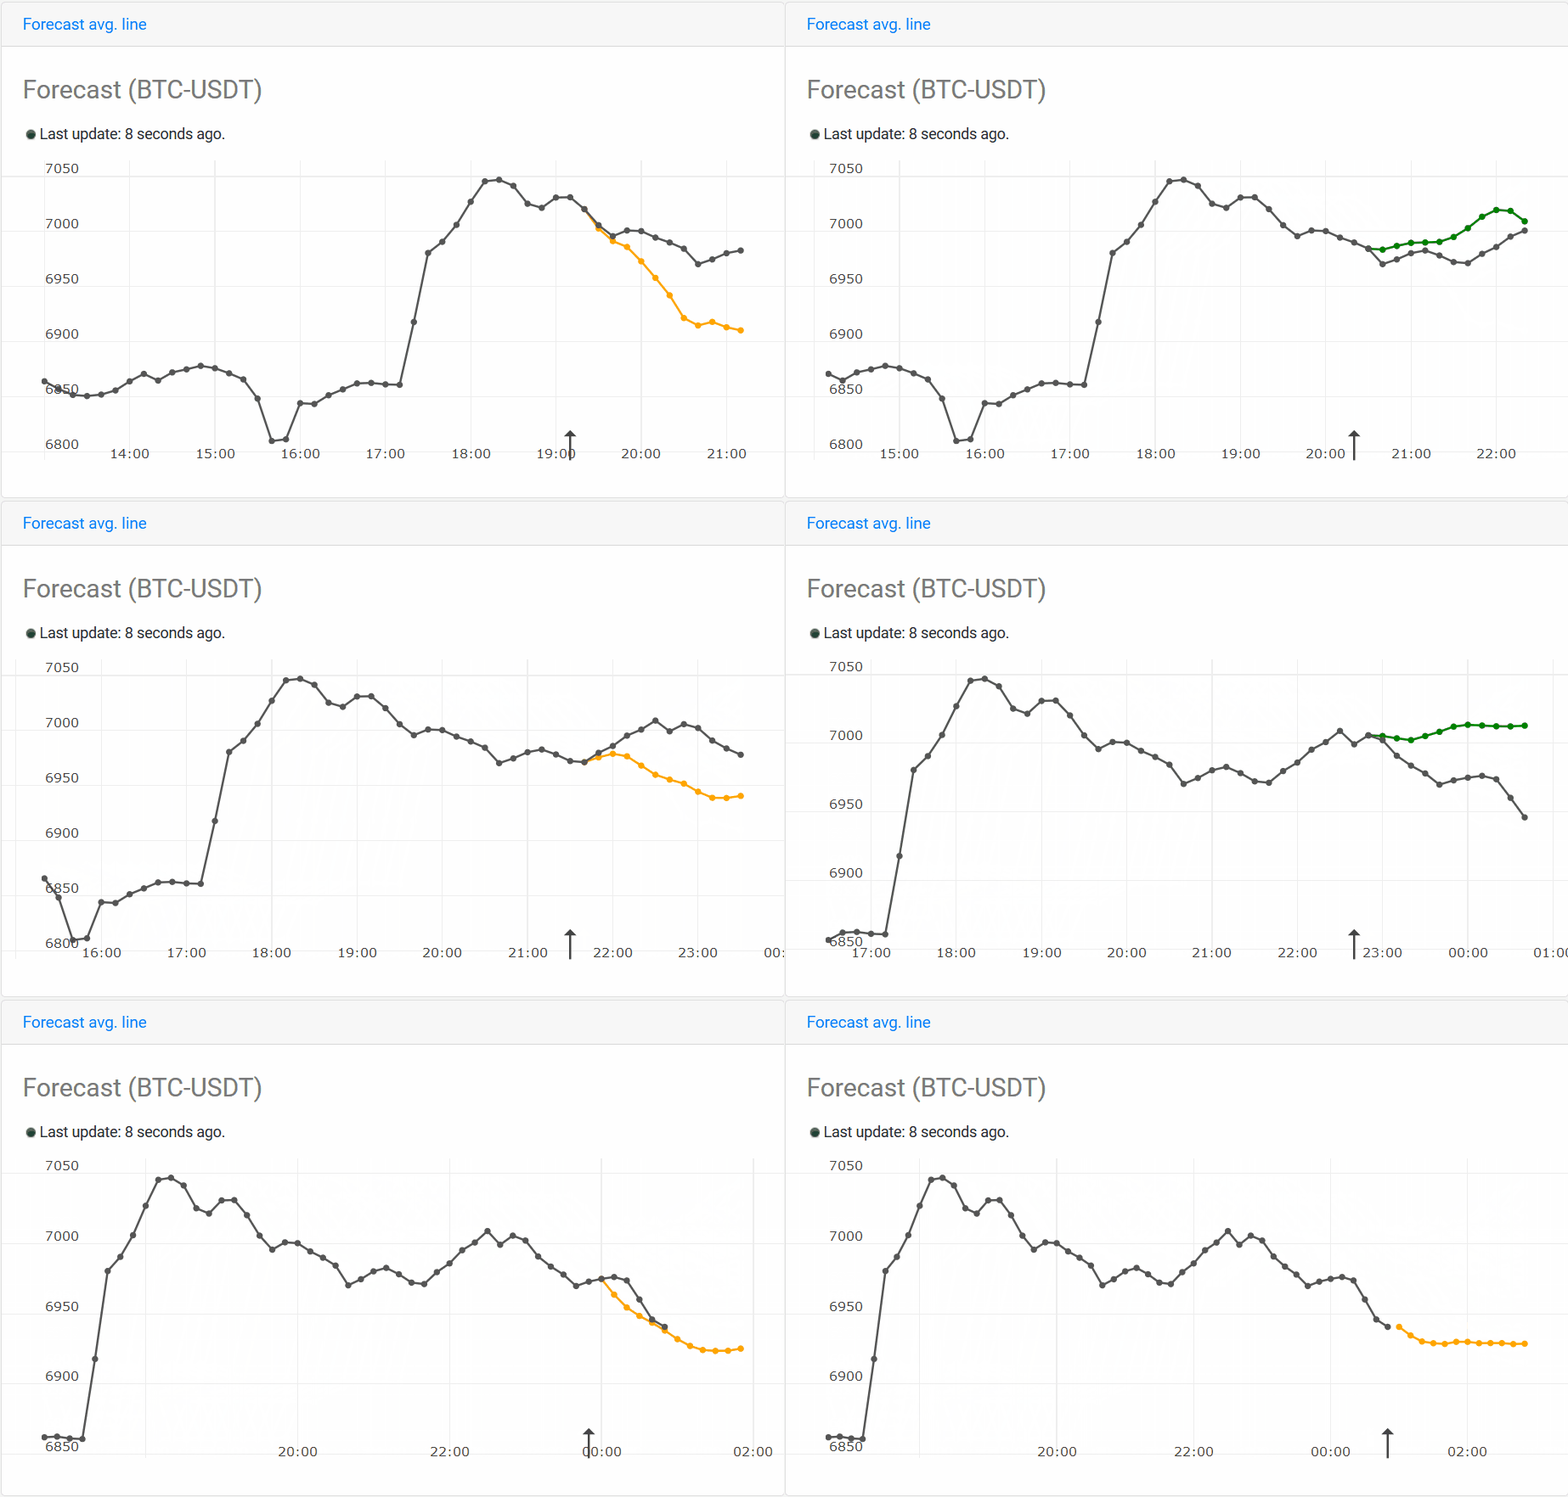
Both Ethereum and Litecoin appear to be no different than Bitcoin when it comes to making predictions. The same logic and reasoning applies. However, I do believe that the predictions will be more accurate for some coins compared to others — with Bitcoin being definitely not the most easy one. Have a look at the next chart and prediction:
The above has a pretty accurate prediction of the price going up for about five intervals, and then it predicts a decline at 22:00. In reality this decline did occur, but it took several more intervals — once again the system isn’t that good at predicting “when” something will happen, but it does a great job at telling us “what” might happen.
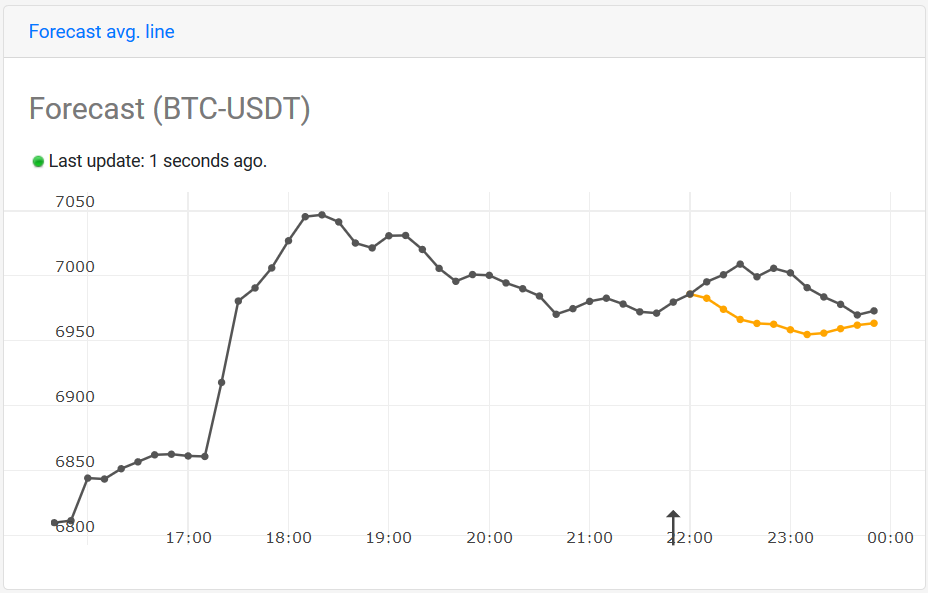
Stepping a few intervals ahead, I noticed that the system remained persistent in the sense that it still predicted the price to go down at 22:00; but the decline did not occur until 23:00. However once the market has reached a local max, as shown on the chart below, the prediction became pretty accurate.
Summary
Reading a blog post while also trying to make sense of the charts isn’t the easiest way of consuming good content. So to recap I have generated animated GIFs that show the predictions at every step/interval as discussed above.
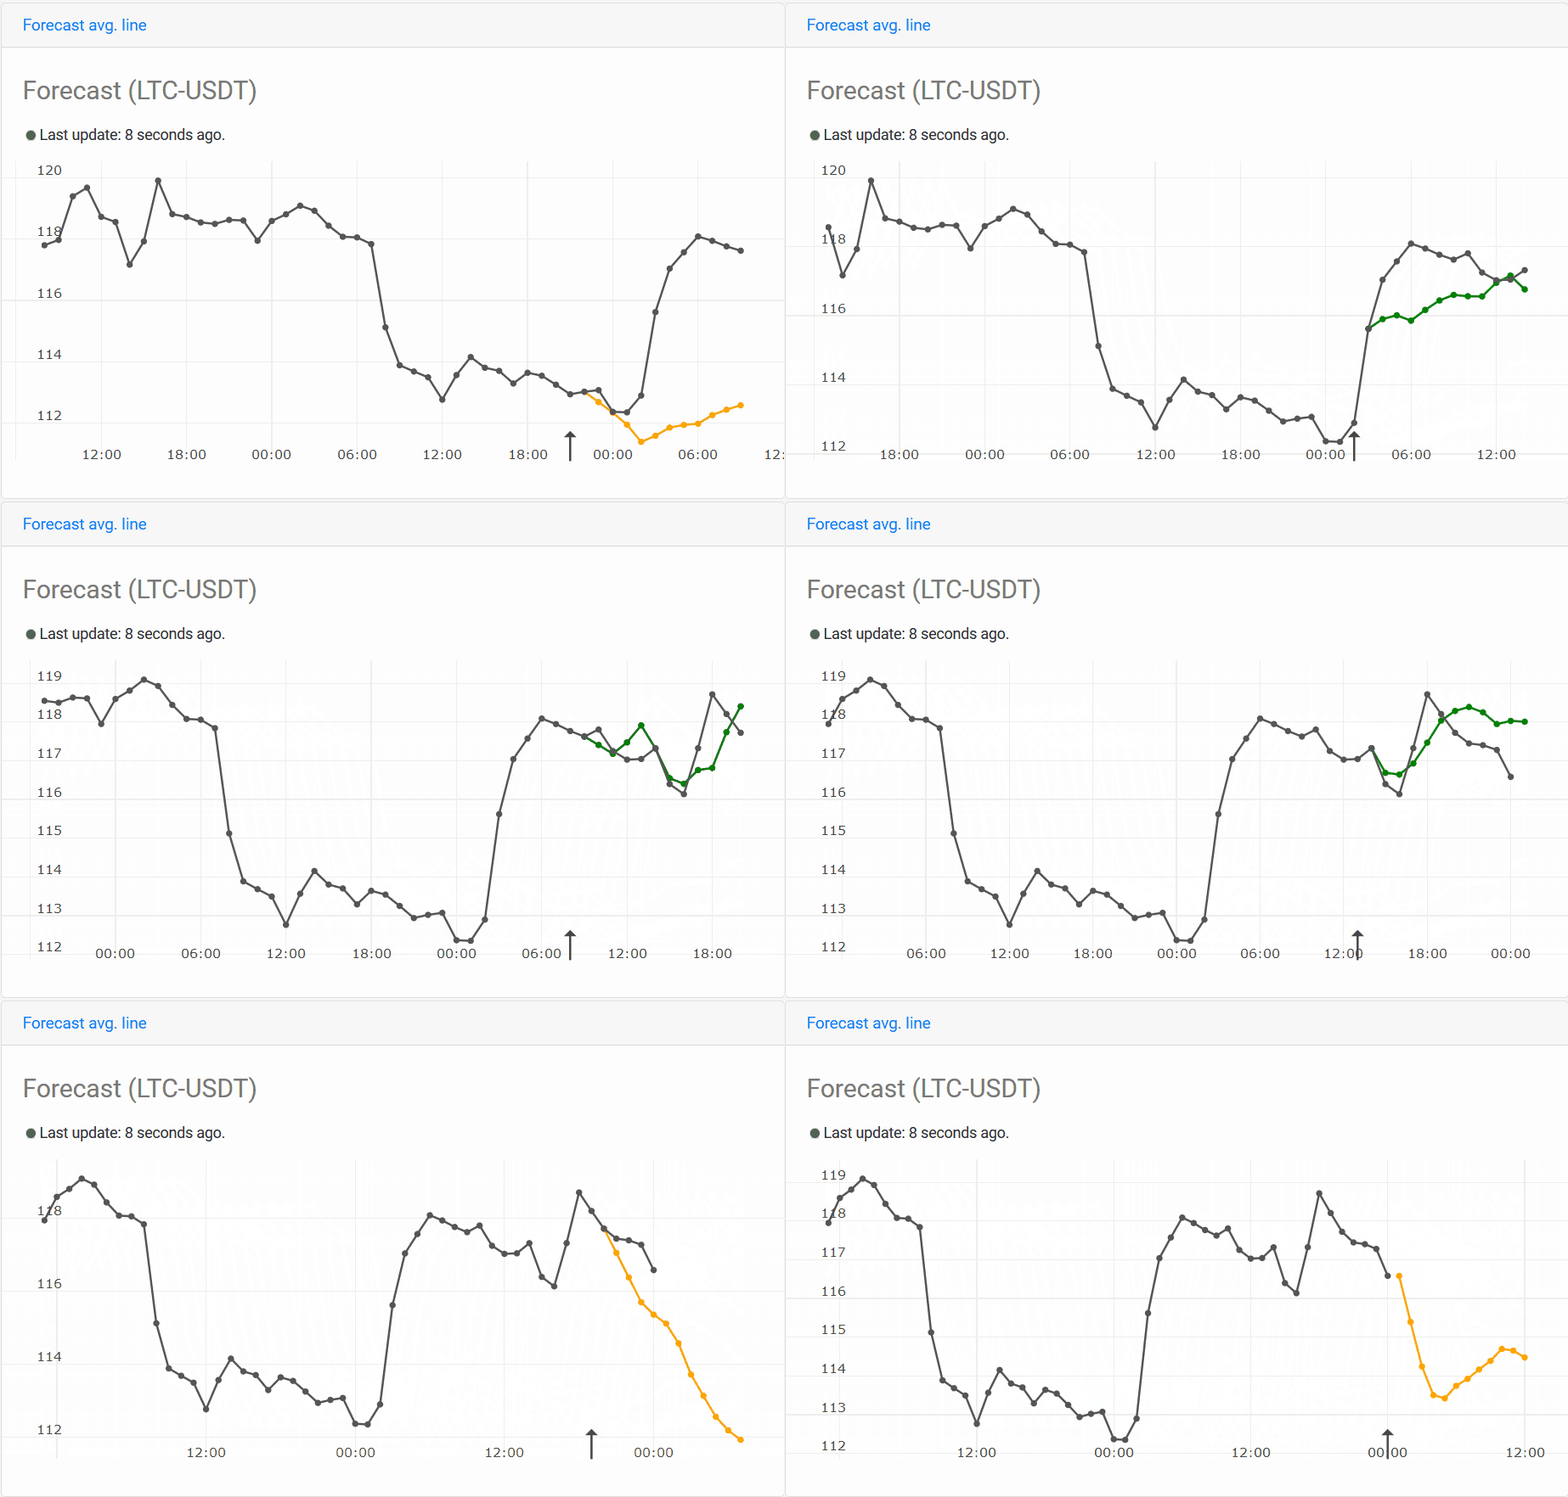
Litecoin:
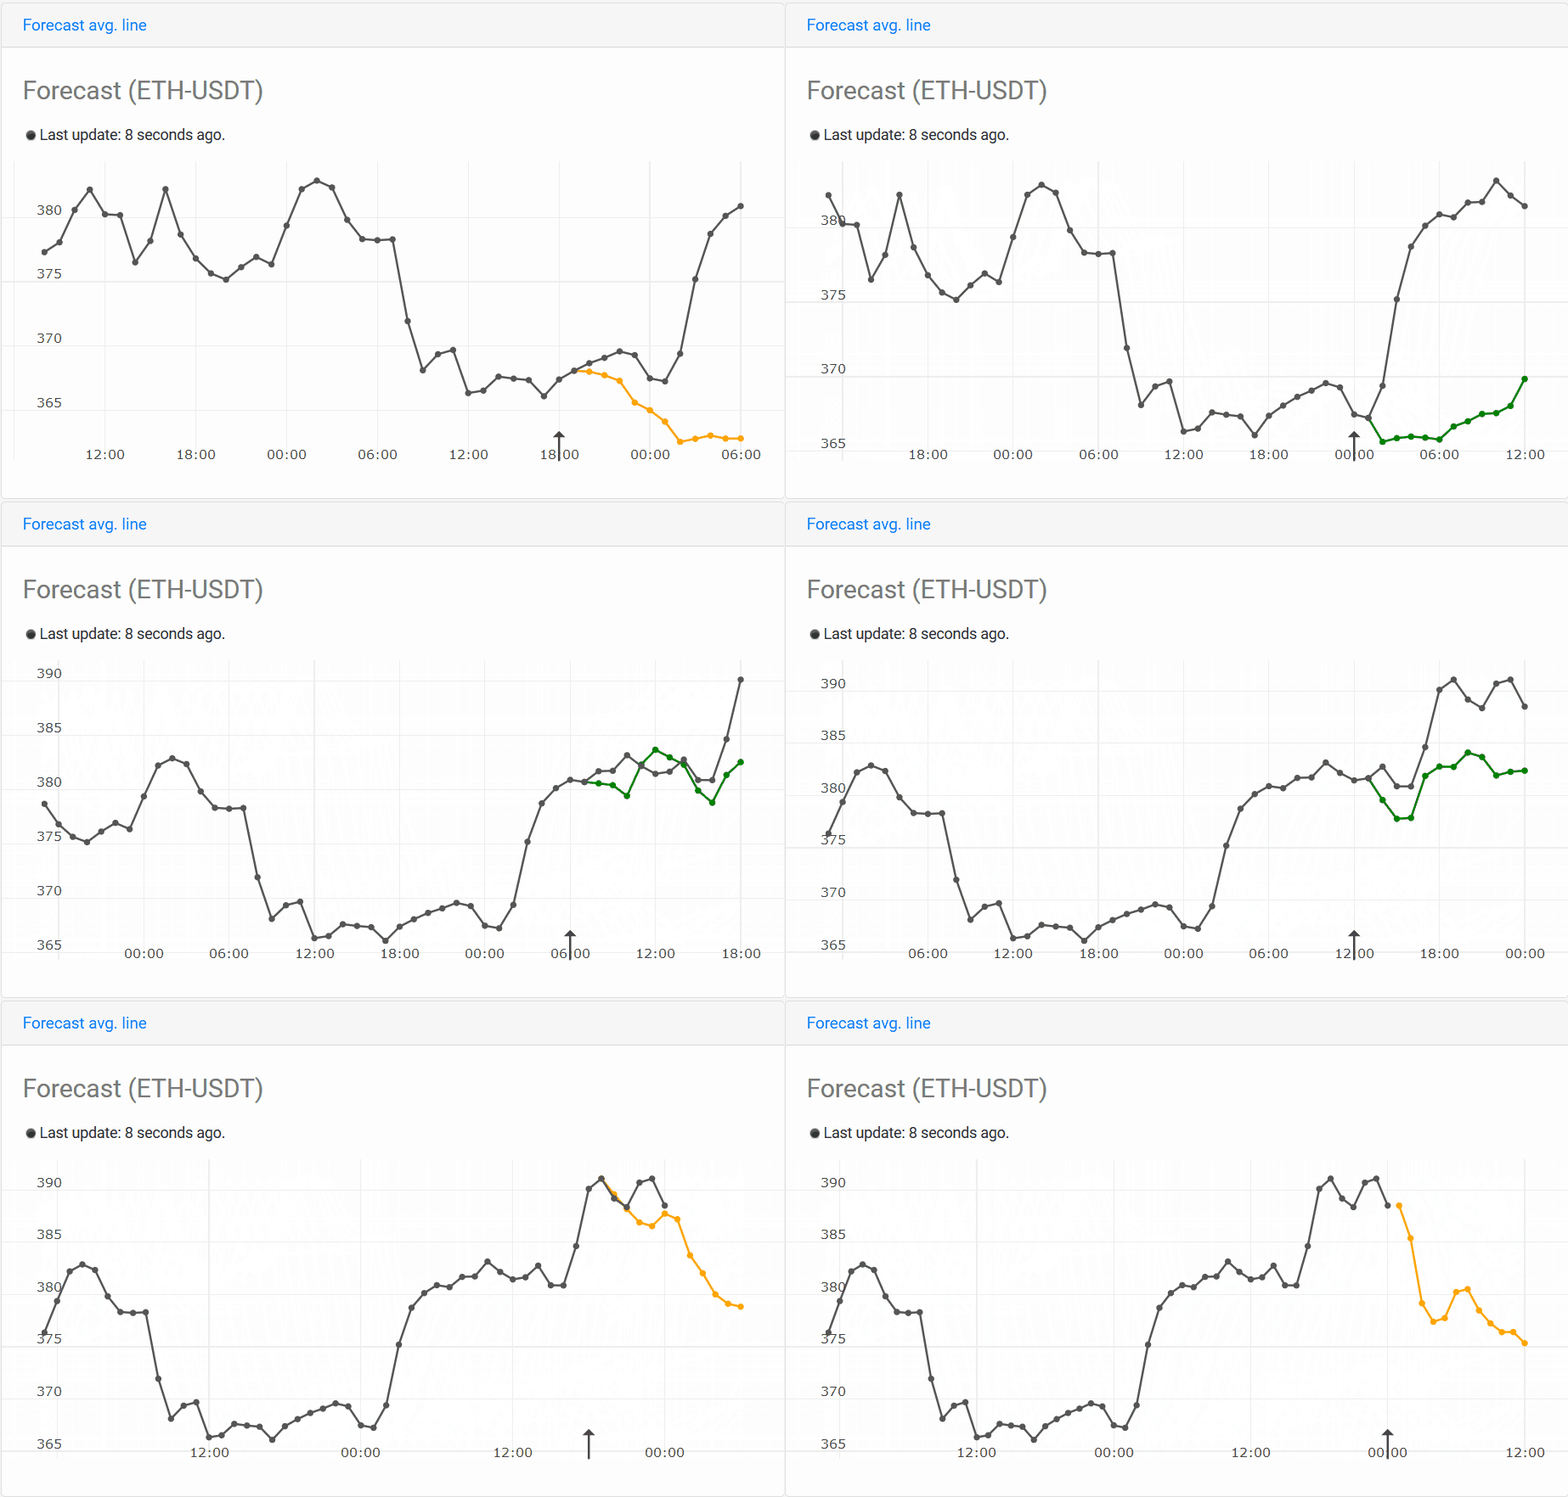
Ethereum:
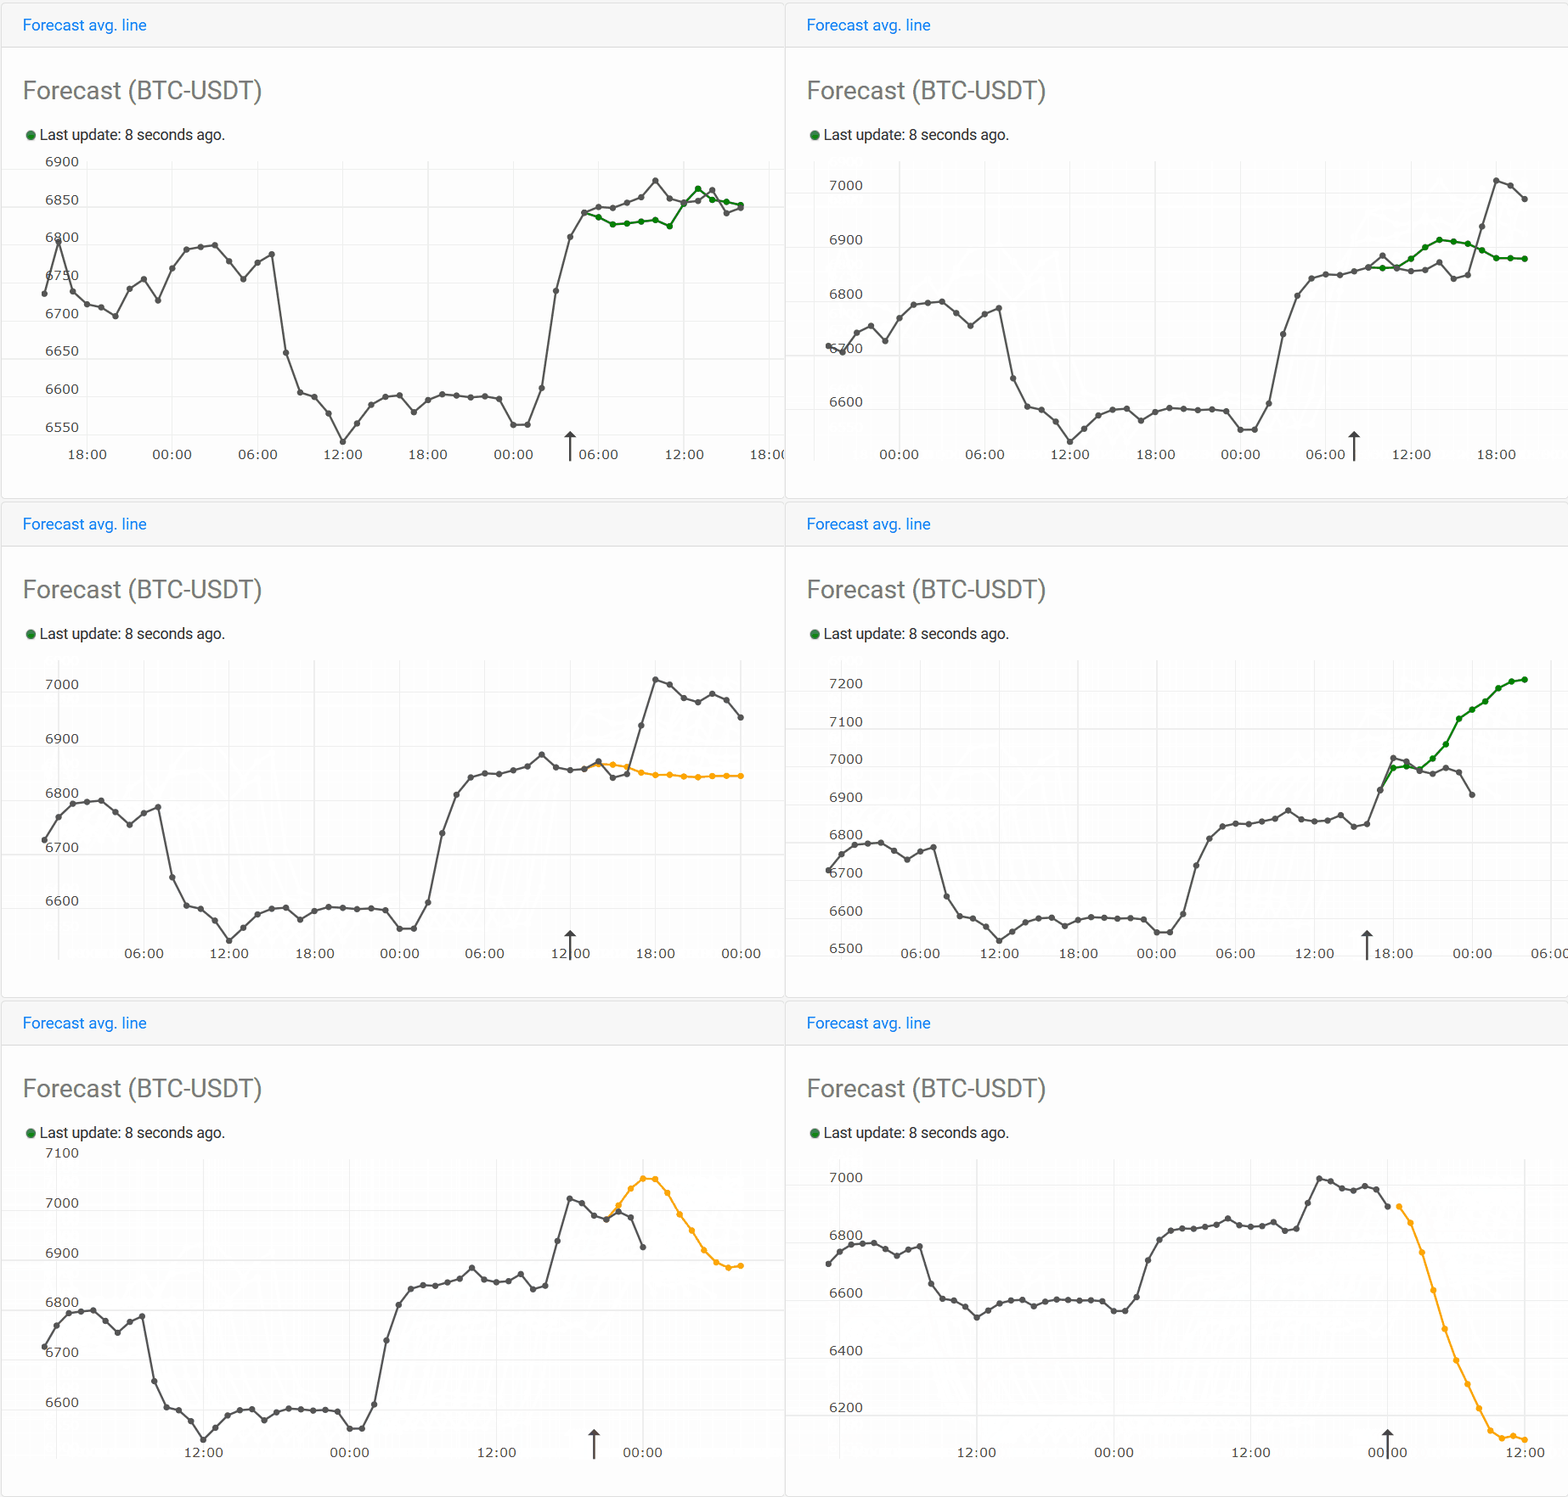
Bitcoin:
In all of the above we have used 10-minute intervals, as an extra I have also generated animated GIFs from charts with 60-min candlesticks:
Litecoin:
Ethereum:
Bitcoin:
Did you notice how accurate some of the Litecoin and Ethereum predictions were? Then also try comparing them againstthe Bitcoin predictions. It appears to me that ETH and LTC predictions (at 1-hour intervals) are way more accurate than the BTC ones. However, this is not a statistically proven/validated statement, and we have only analyzed a tiny fragment of a large data set.
Final words
These data-trained AI systems are pretty complex. They are like a black box which we feed data into and then it spits out “something”. In some cases the output is surprisingly accurate, while in other cases it was way off. But the most important factor is that the system is continuously learning, and it’s also able to adapt/adjust itself very rapidly — i.e. it does not take many iterations before it “changes its mind”.
The most tricky part is how do we apply these predictions to actual trading? This is a topic we are continuously working on and are making decent progress. Stay tuned for the next episode.
Thank you for reading and have a great day!

- Ilya