Cryptocurrency analysis and predictions using AI and big data

While it's true that probability and statistics are incredibly eye-opening - like, for example, the vending machine vs. shark debunk - it's important to remember that correlation isn't causation. By that I mean that just because one thing happens right after the other, it doesn't mean that the first caused the second.

On the other hand I think it makes sense that hype influences the value of the coin since with more people knowing about it, the more chance they will invest in it - a way to solidify this idea would be to study other cryptocurrencies that might arise in the same way Bitcoin did in terms of popularity.

Anyway, great post, can't wait for more :)
 
While it's true that probability and statistics are incredibly eye-opening - like, for example, the vending machine vs. shark debunk - it's important to remember that correlation isn't causation. By that I mean that just because one thing happens right after the other, it doesn't mean that the first caused the second.

On the other hand I think it makes sense that hype influences the value of the coin since with more people knowing about it, the more chance they will invest in it - a way to solidify this idea would be to study other cryptocurrencies that might arise in the same way Bitcoin did in terms of popularity.

Anyway, great post, can't wait for more :)
Yes exactly, I mentioned this several times throughout my posts on this thread :)
Thanks for the input!

@healzer, I will like pick your brain on data science A.I related projects. I'm not a newbie but far far behind what knowledge you've acquired. I'll like recommendations from you on how best I could scale my game up and set things to work pretty good... Sharing with your sources of learning would as well be appreciated.

Regards.
That's a great question, but there's no definite answer.
You should try to learn as much AI on a higher level through reading newbie friendly blog posts and watching youtube videos (there are a ton).
Once you have done that, start watching some deeper stuff that has more math/data science (like MIT courses), and see if you can understand & learn those.

The idea is to first acquire as much general knowledge as possible -- learning about Neural networks , then learning about training strategies, etc...
Once you have this general knowledge, pick one field to focus on, especially one you could already apply in your industry/business.
This is how I did it, when I started this project I knew ZERO about AI/ML, but since I come from a programming/math background I could easily learn these things and apply them.

It's way more fun if you're learning to achieve something. My goal is to build the best crypto analysis & prediction tools/products.
If it wasn't for the sake of building a business, I wouldn't bother learning AI, because what's the use of having a dictionary in your head if you're not applying it right? :)

Hope this helps man :)
 
Update for 30 & 31 March 2018
  • We are working on a cross-platform app, a lot of back-end preparations were made.
  • I've been primarily working improving the server-client speed/response through various optimizations.
  • Until now I have been using Apache Spark to consume, process and persist a high throughput of data. After careful analysis we are no longer using Spark due to its memory and CPU usage which is way higher than a custom solution suited for our needs.
  • Database maintenance & query speed optimizations.
The rest of this day will be spent on development of the new app.
Have a nice Sunday! :)
- Ilya
 
Forecasting Bitcoin, Litecoin and Ethereum
In recent months millions of people have entered the crypto space and diversified their portfolio by investing in different coins. Only a small percentage have made a nice profit, while most lost a major chunk of their investment. Some have even sold their household items, their car or taken on a loan to invest in crypto. These are all somewhat reckless decisions, unless the person had it all planned out — but 99% didn’t.

1*fvCsSu1hHRJNYhd7Zc1kkQ.jpeg


If only these people had more knowledge then they would have made better decisions. Instead of losing over -30% of their investment, they could’ve easily made over +40%. Unfortunately nobody can look into the future, except if the market is rigged and/or influenced by insider trading.

However, technology does allow us to make short-term predictions of where the price might go. This wouldn’t be possible without the latest techniques and innovations in machine learning algorithms and artificial intelligence systems. So making short-term predictions for Bitcoin, Litecoin and Ethereum is on today’s menu, but first some development news.

What we’ve been cooking
About three weeks ago we have decided to focus our efforts primarily on developing a brand new mobile app. Our current app (which you can find on the Google Play store) is limited to Android devices, so to cope with the cross-platform ideology we shall develop a web based app that works on any platform as long as there is an up-to-date web browser, e.g. Firefox, Chrome, etc.

In a week or two we shall release a roadmap/timeline of all the features we plan on integrating. These new features will go far beyond just making price predictions. But we will remain true to our core, which is providing only the most necessary tools & features to crypto investors and traders. No matter what your skill level is, beginner or expert, we’ll make sure you have all the tools you need to be more successful.

Improving in-app predictons
1*LfCKL6fovt6yXNDVW5mGEA.png

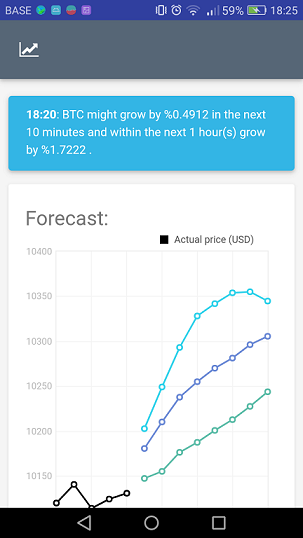
If you have been using our current app, then you know that the predictions are generated only every 10 minutes (or 60 minutes for hourly intervals). This is so because of technical reasons. But we have made new progress and figured out how to improve our system to generate a new set of predictions every single minute. However we do not plan on going going smaller than a minute anytime soon, unless there is a specific purpose and reason behind it.

Another thing that has been bothering me is that the charts aren’t always refreshed automatically. We want our data and predictions to be displayed in a real-time fashion just like on an exchange. But since we are not an exchange per se, we don’t want to induce a lot of unnecessary overhead and network traffic by pushing updates every second or so. Instead we have opted for pushing price & prediction updates every ten seconds, with the ability to disable/enable real-time updates.

Anomaly detection
Some of our users have complained that they’ve been receiving push notifications too frequently. This is an issue we are tackling right now — we want to make sure you receive only the most crucial notifications, without missing out on important events. The entire AD system will have a full rework.

Forecasting
Apart from developing the app itself, we have made some really nice progress on our crypto predictions system. In what follows I am going to evaluate the performance of our system on three markets: BTC, ETH and LTC. The data stems from the Binance exchange, if you care to know. But which data exactly, and how it was used to generate these predictions will remain a secrecy.

Note: in what follows, we are going to evaluate the generated predictions against the actual data. To do that we have to look at past intervals. All data and dates used were captured in the past 48 hours.

Ethereum
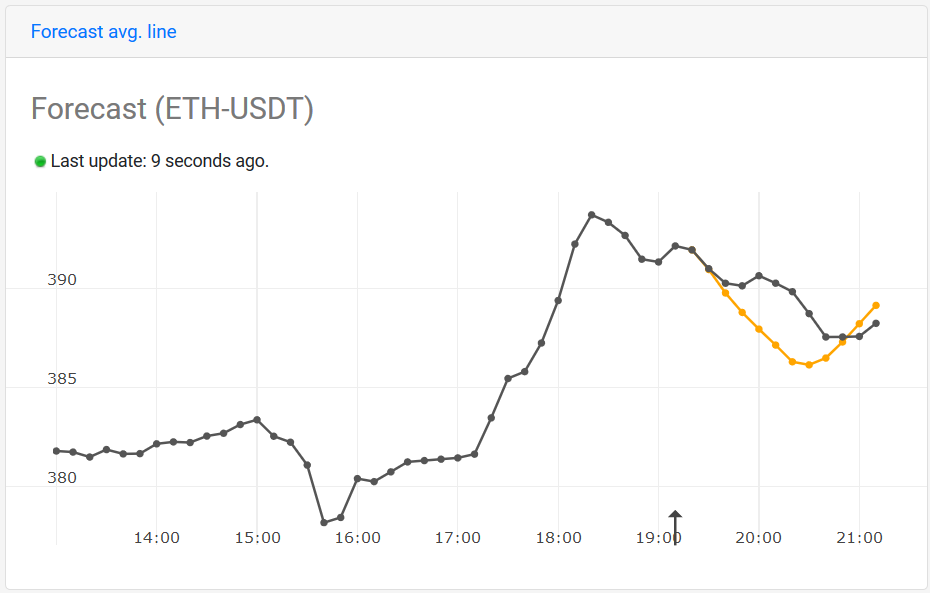
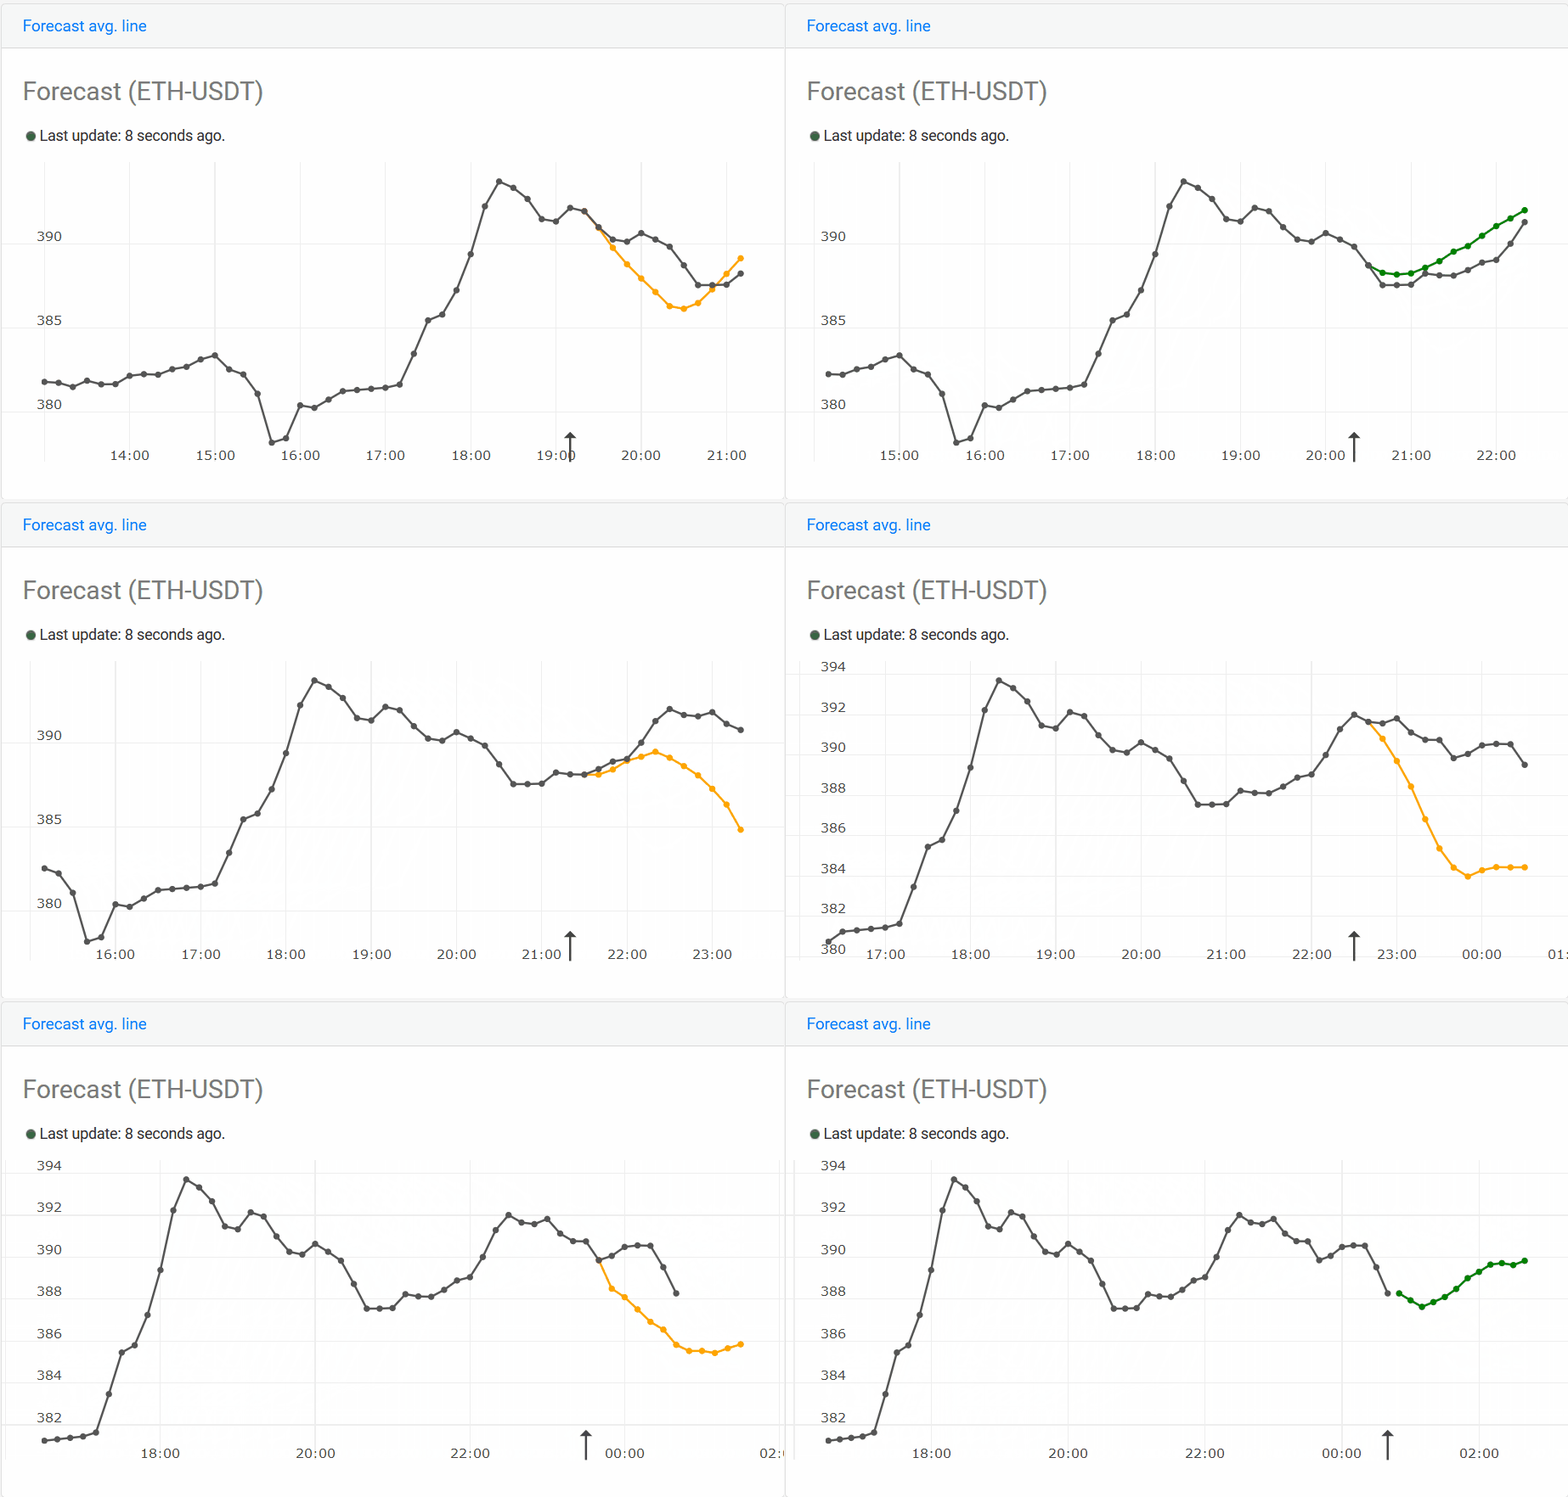
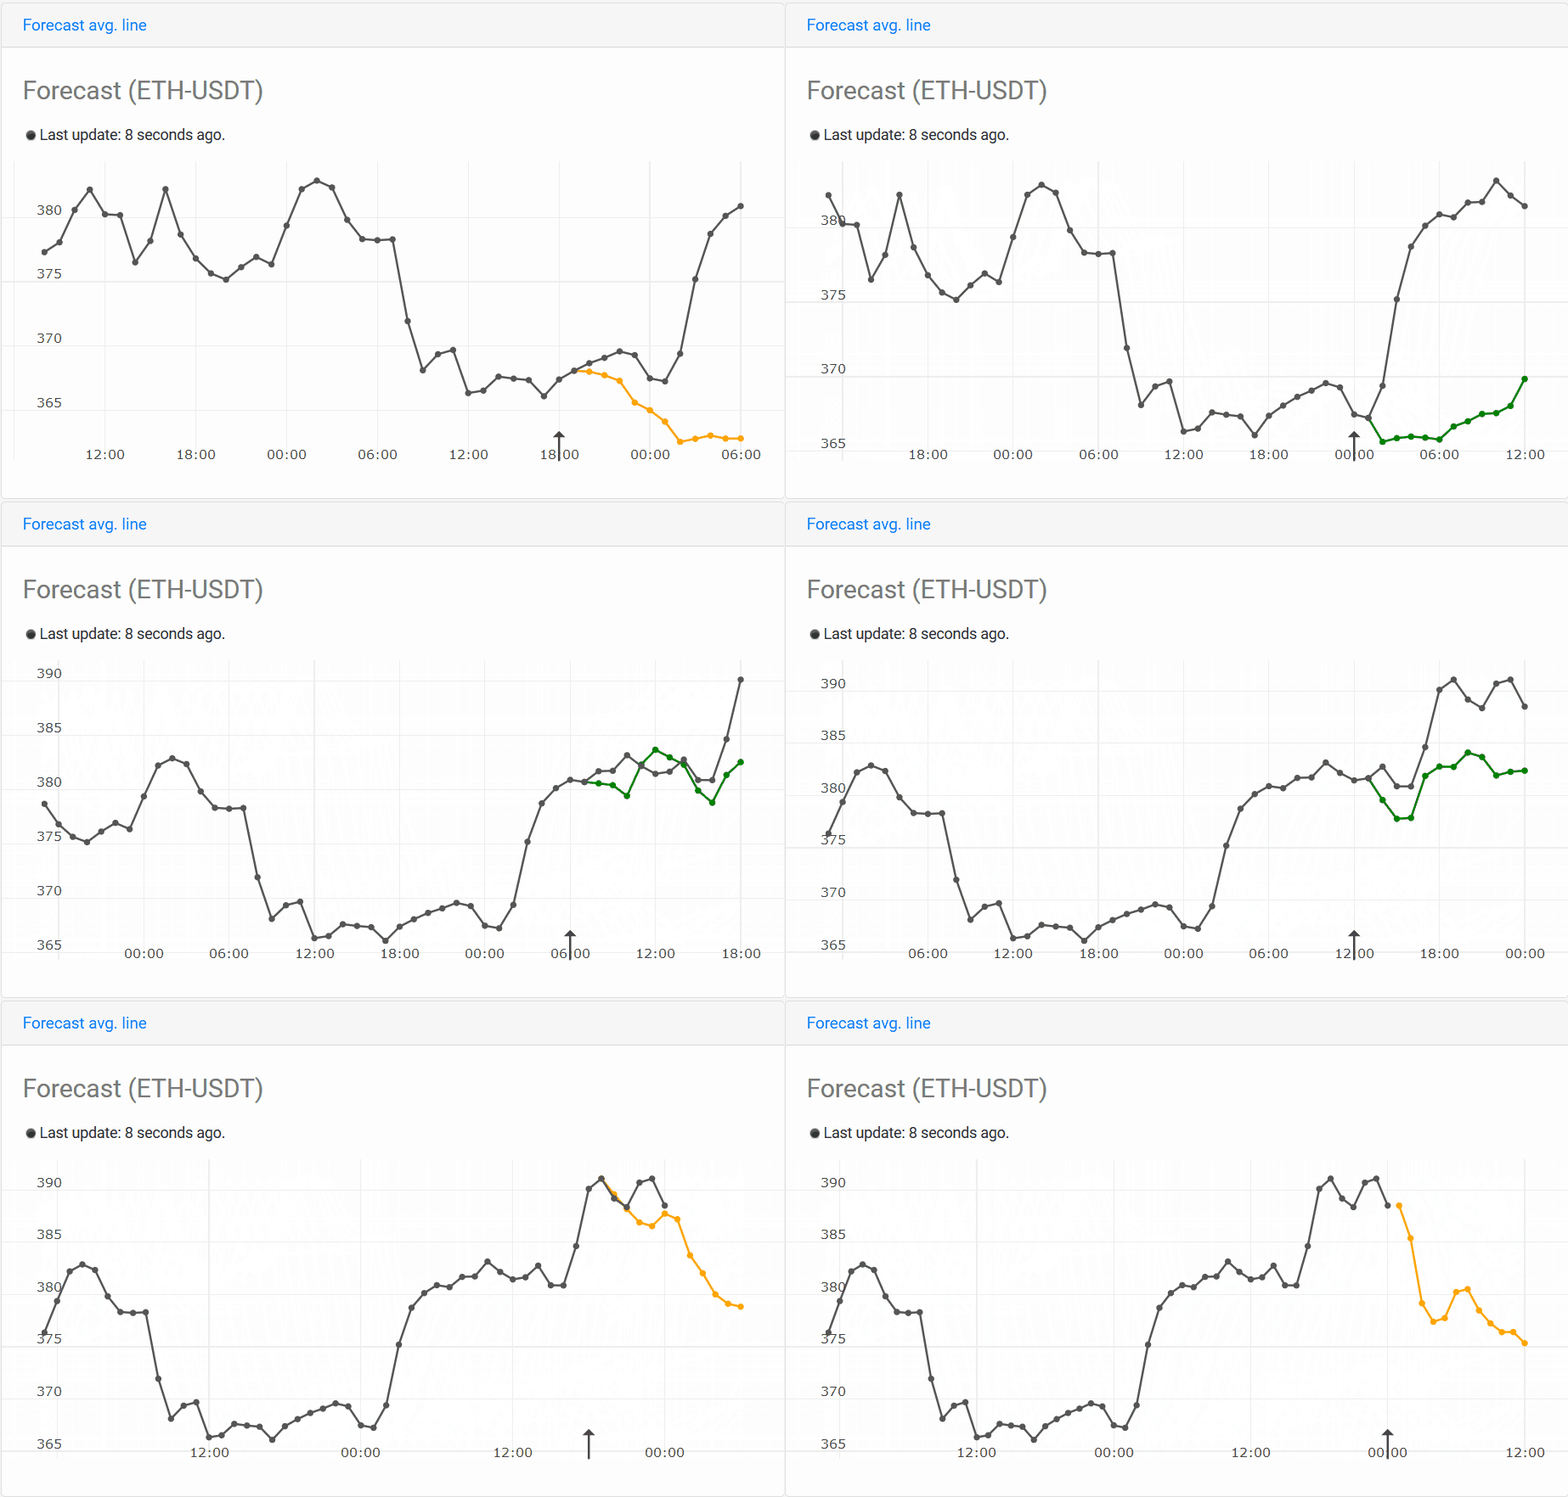
In almost all our previous blog posts we have been evaluating Bitcoin (BTC), so today we are going to add Ethereum and Litecoin into the mix as well. Let’s start we the following chart of Etherum, it’s derived from 10 minute candlesticks:

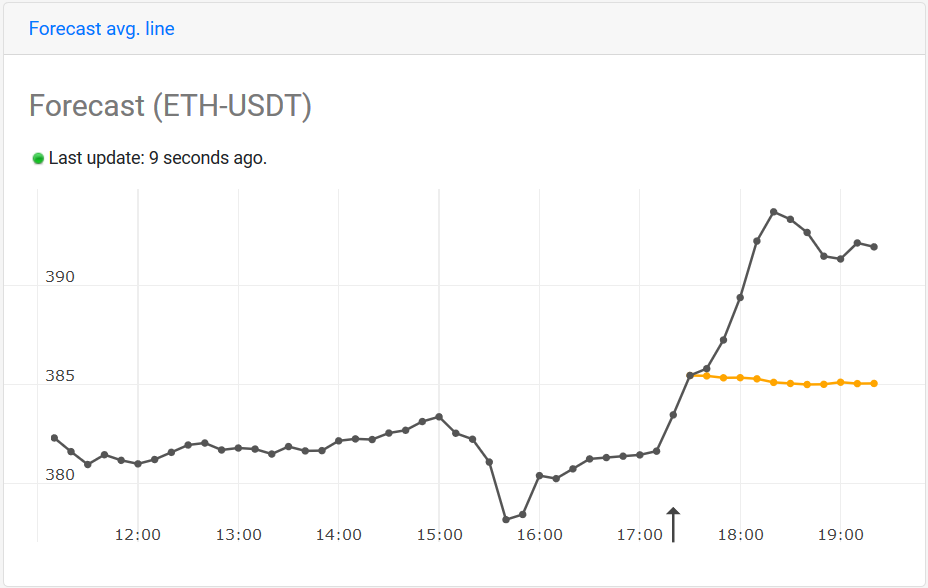
1*KD746gYoENnFDnSnGofzOg.png


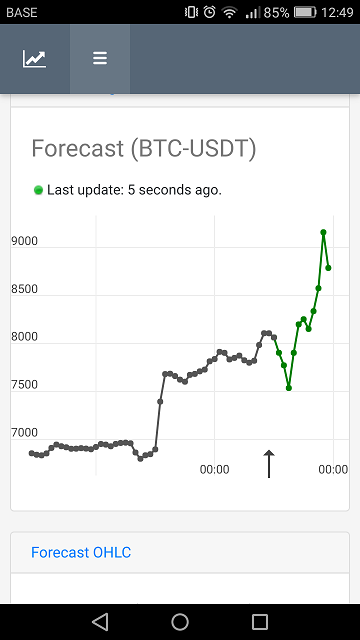
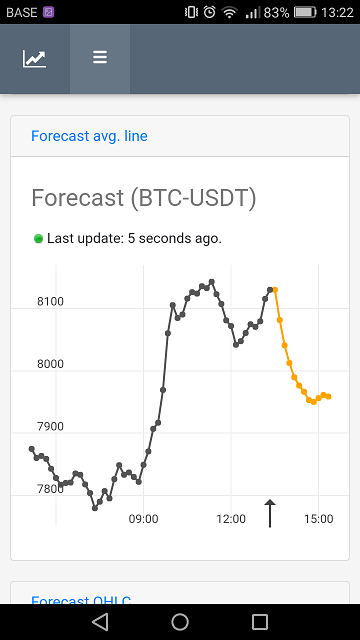
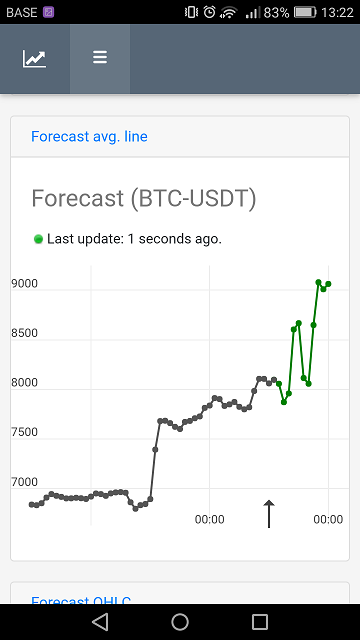
The black line is the actual price (average of Open/Low/High/Close values) — the orange (or green) line represents the predictions. The arrow indicates at what specific time/interval this prediction was generated. So the prediction was generated based solely on data until the arrow (so it’s not “over-fitted” in machine learning terms). In this case the prediction is not accurate at all. It shows that the price will stabilize after rapid price increase. And there is some logic behind it — the system may have learned that after such an event there is usually a period of stability, so that’s why it’s indicating just that.

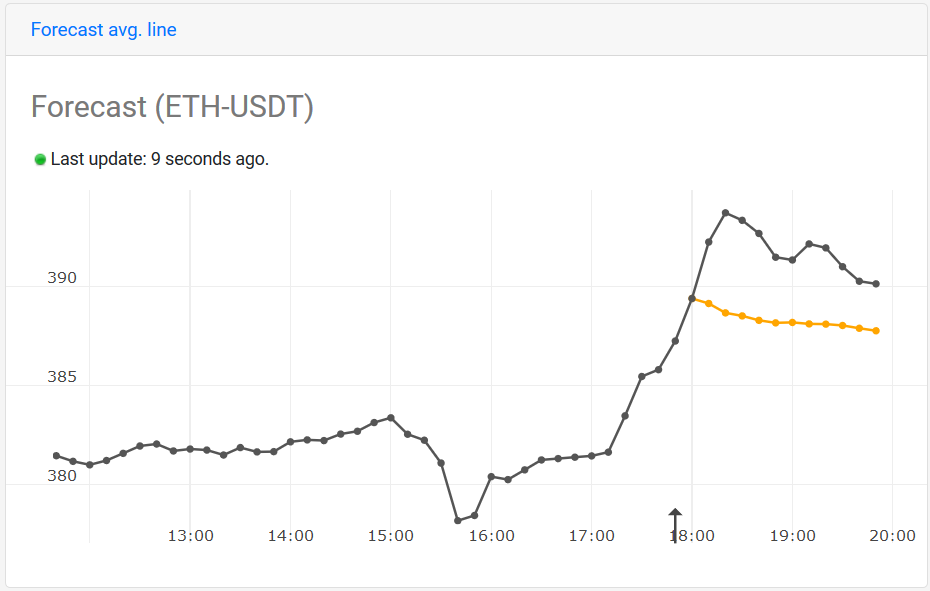
1*B6slxahiyoHbiQoMMoiuHg.png


Now let’s step ahead a couple of intervals, but we still see that it showing a period of stability. This may seem odd, but I still hold on to my previous statement — it’s expect the price to start stabilizing soon. By comparing it against what really happened, the price didn’t stabilize but went up even more.

On first sight these predictions seem to be inaccurate, that is only if we interpret them in absolute terms. They do however become more apparent and meaningful when you look at them as “forecasts” — this means that there is a high probability “some” event is going to happen soon, but we don’t know “when”. Our prediction system cannot predict “when” something will happen, but it does a really good job at telling us what the “some event” might be. There are several good reasons why this is so — without explaining every single one of them, it is that the market is pushed/influenced by external factors (i.e. people/traders), and since people’s decisions are pretty much unpredictable, so is the “when” factor as unpredictable.

Let’s step ahead to the highest point on the chart and see what the predictions tell us:

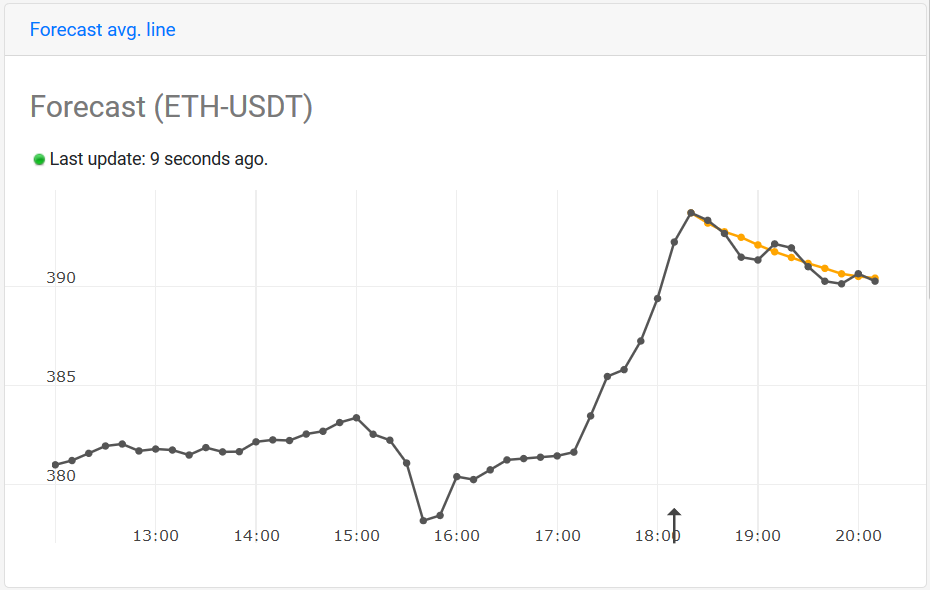
1*bn7o7xxcULBrh8uMZoZDLg.png


From the above we clearly see that the predictions are finally in harmony with our reality. They have finally reached their optimal state, such that the “some predicted event” has began to manifest.

Stepping ahead 50 minutes (5 intervals) ahead we see some new interesting pattern:

1*i_BOdVtny3WNvRyiUsjO1Q.png


In the above, the system is forecasting the price to go down in a linear fashion until it reaches a certain point and then goes up again. The reality wasn’t that far off, but it did it in a slightly different fashion.

Throughout my experiments and analyses, I was always stunned by how well the system adapts to minor changes. Here’s what I mean… have a look at the chart below:

1*TJ45fJkSpU5m8LSXogDYLQ.png


At this interval the predictions indicate a strict decline. Now let us go to the next interval, where the system has corrected itself and generated a new prediction:

1*mr4mcRn_AcESFXNDe43DDg.png


The above looks way better now doesn’t it? It learned that the price didn’t go down even further as it initially predicted, so it readjusted/adapted itself in a clever way.

Litecoin
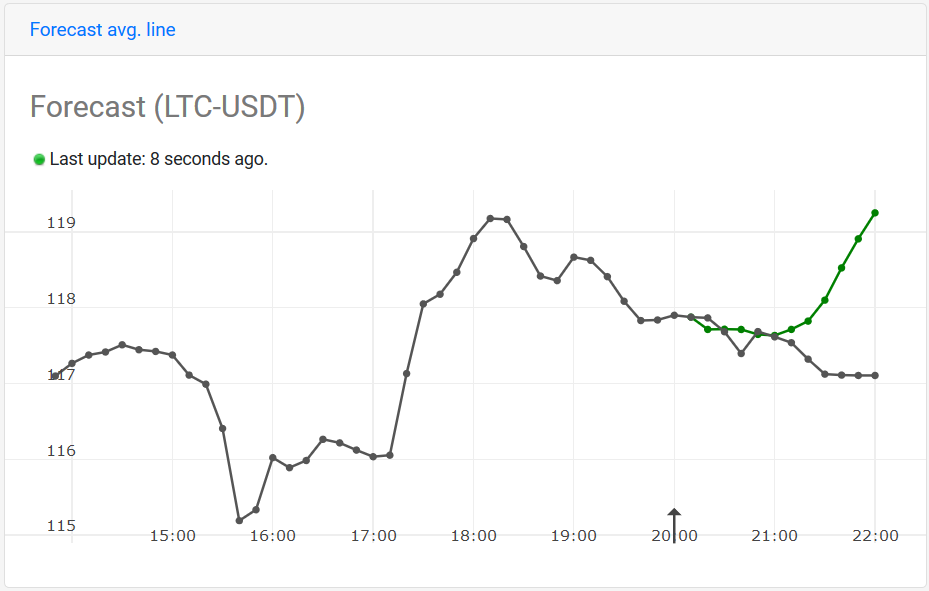
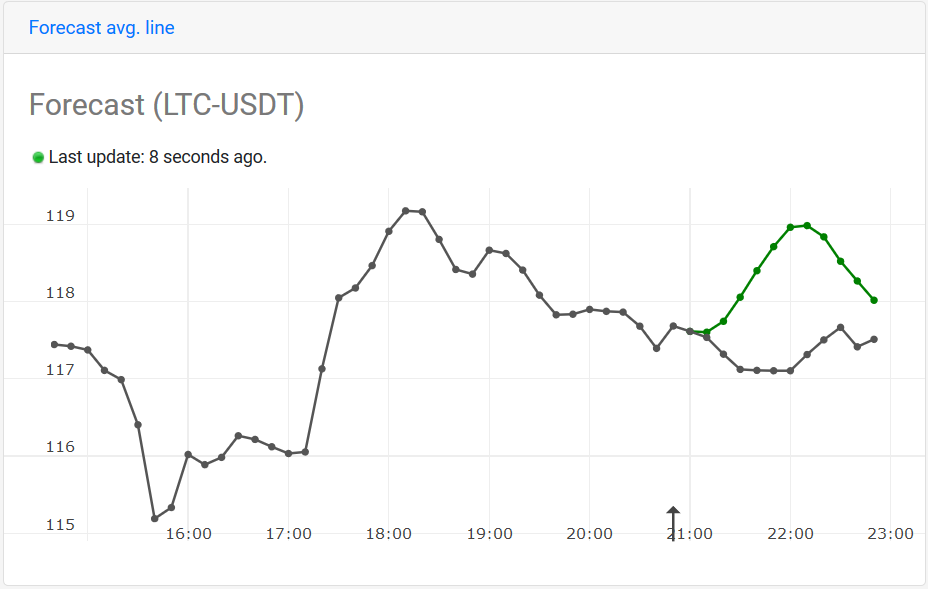
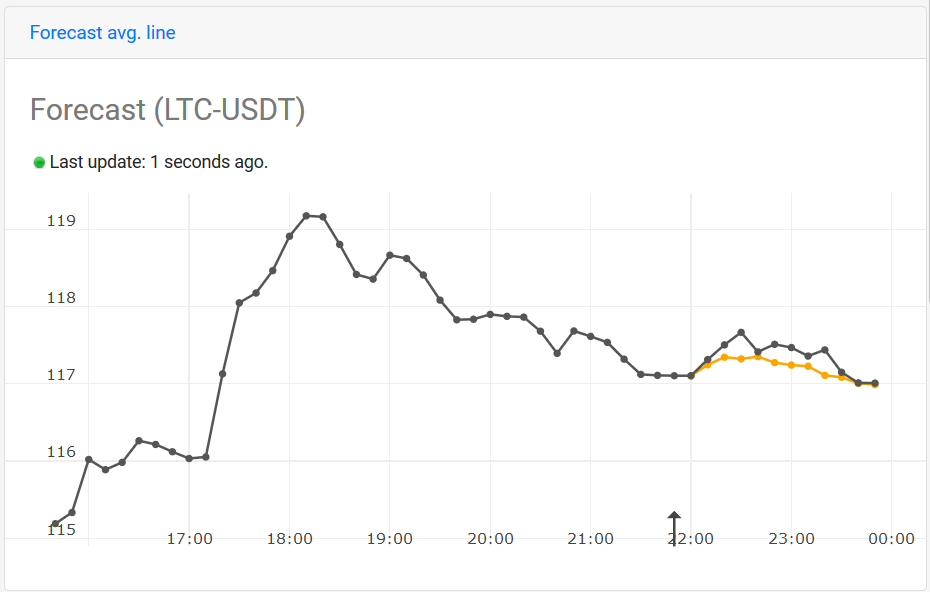
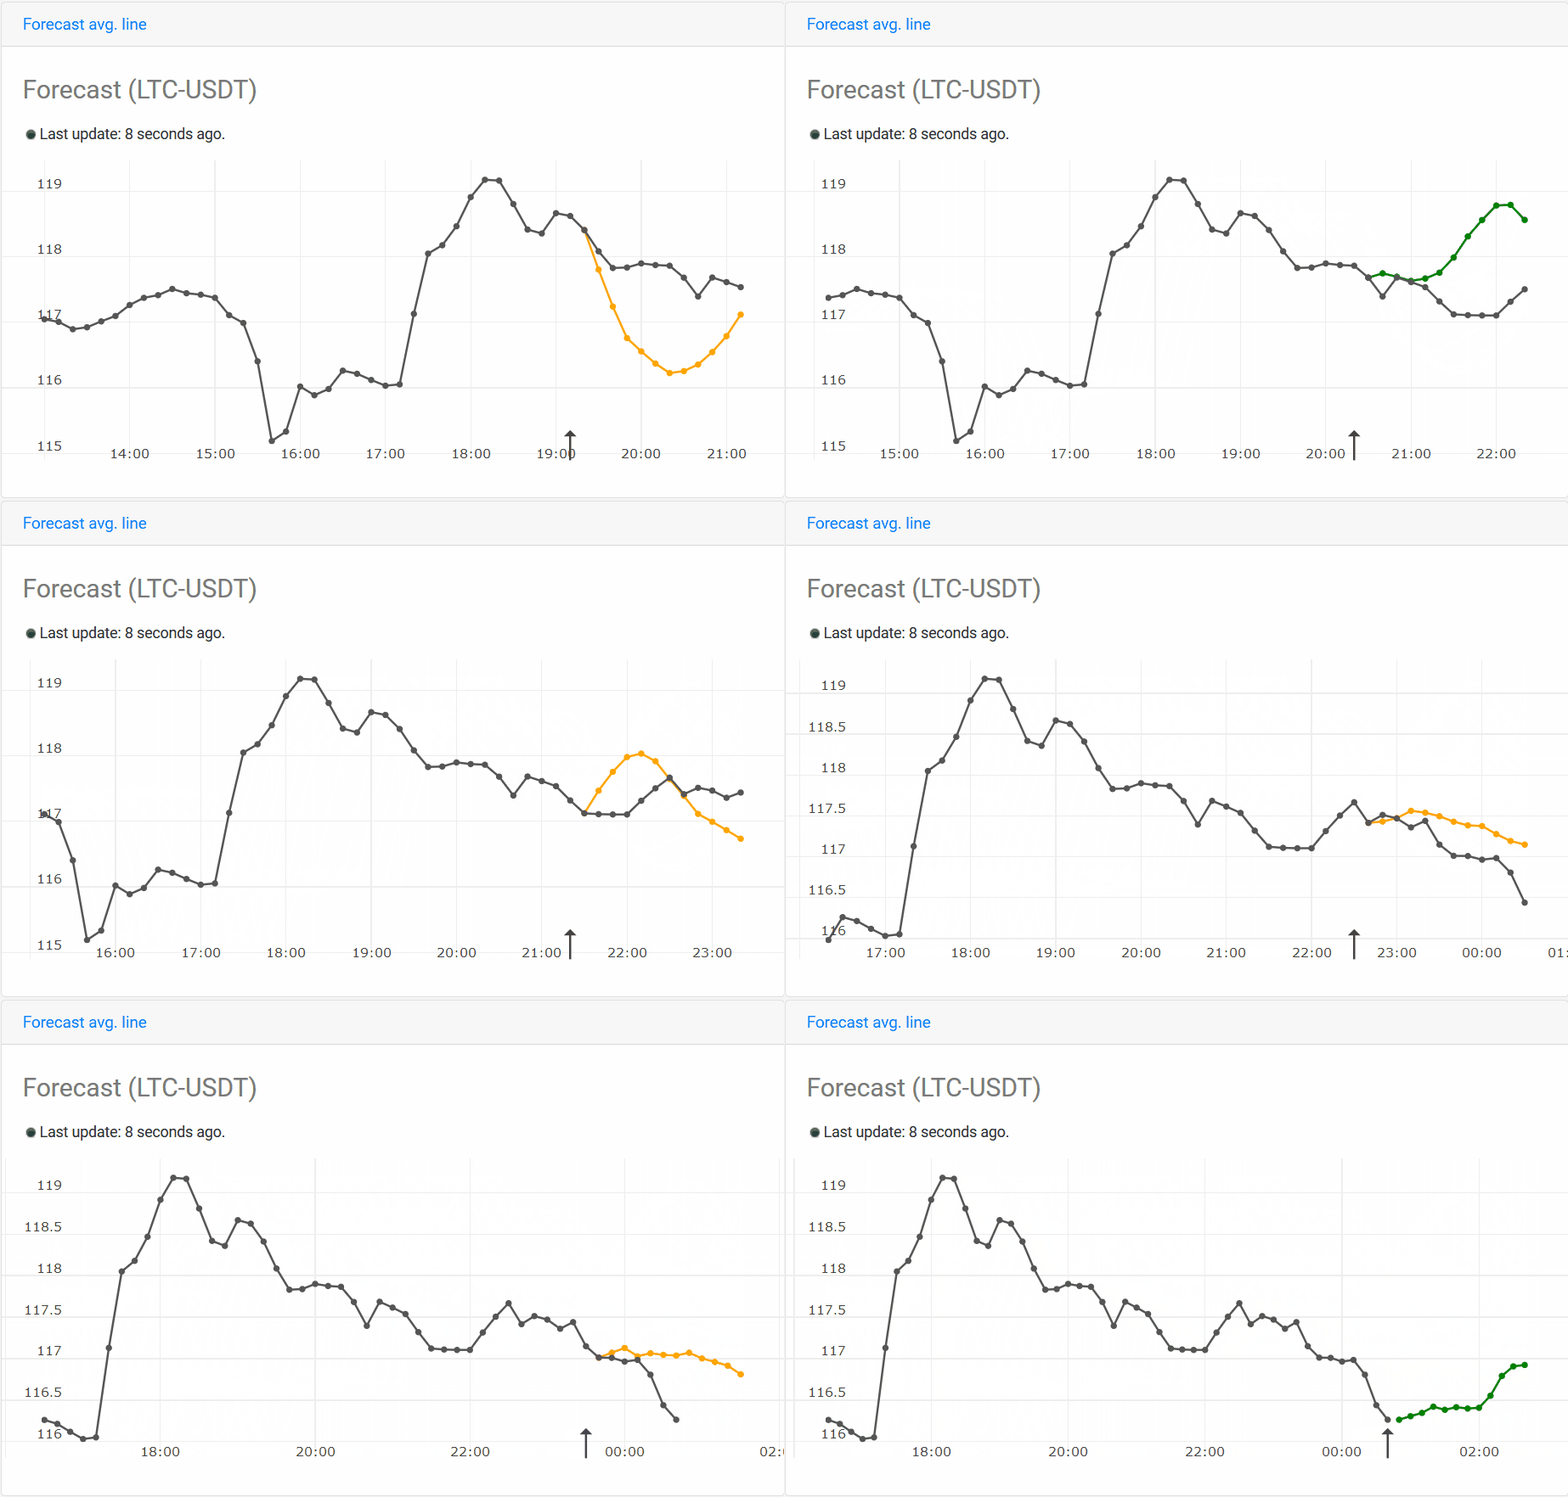
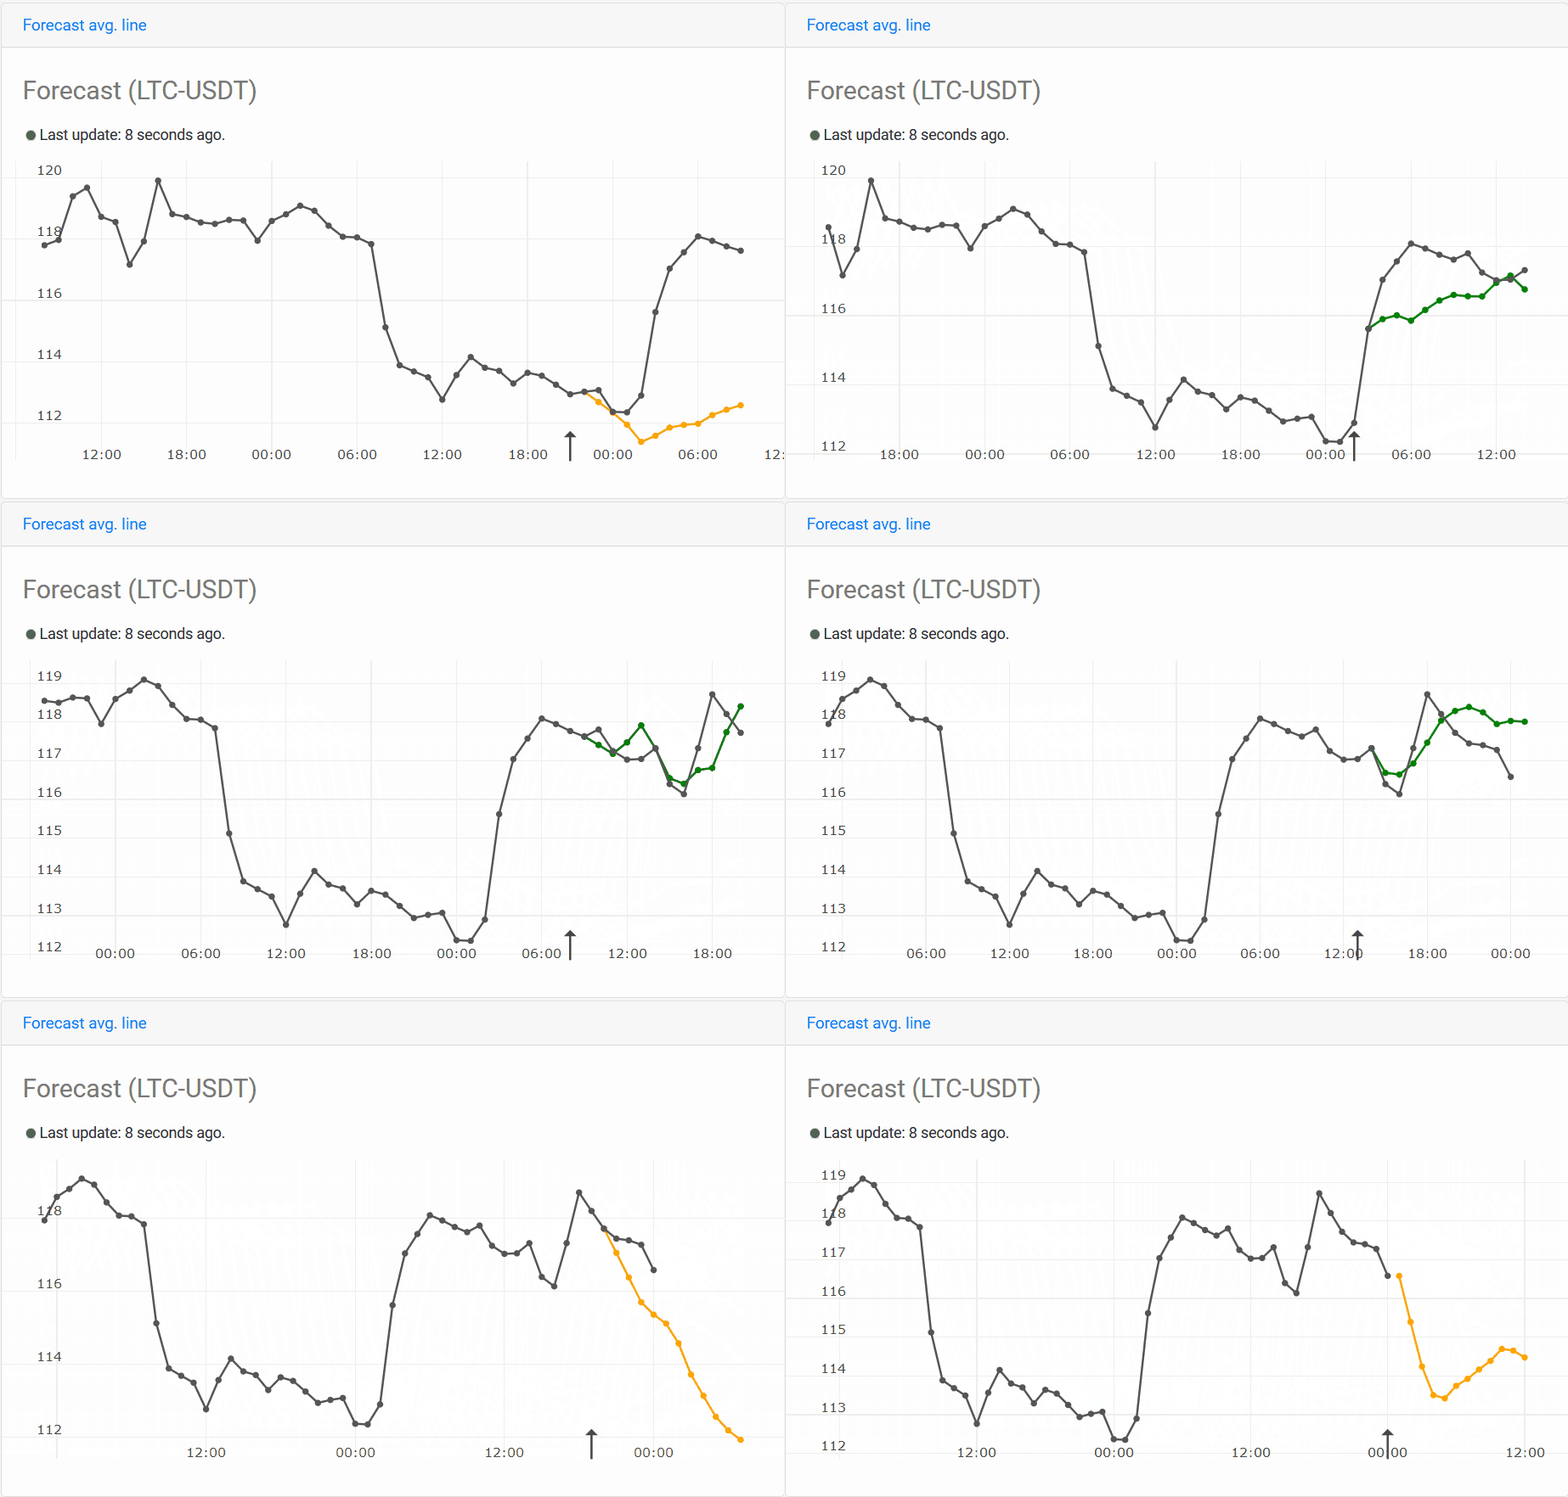
In the case of Ethereum I have shown how well the system can predict near-future events and adapt itself to new events. But it doesn’t always work out that great. In some cases it’s predicting utopian events:

1*0pnQThY5myIx6dLIt6iX-w.png


In the above it shows that the price will remain stable more or less until 21:00 and then shoot up — this did not happen in reality, but definitely a nice attempt nonetheless.

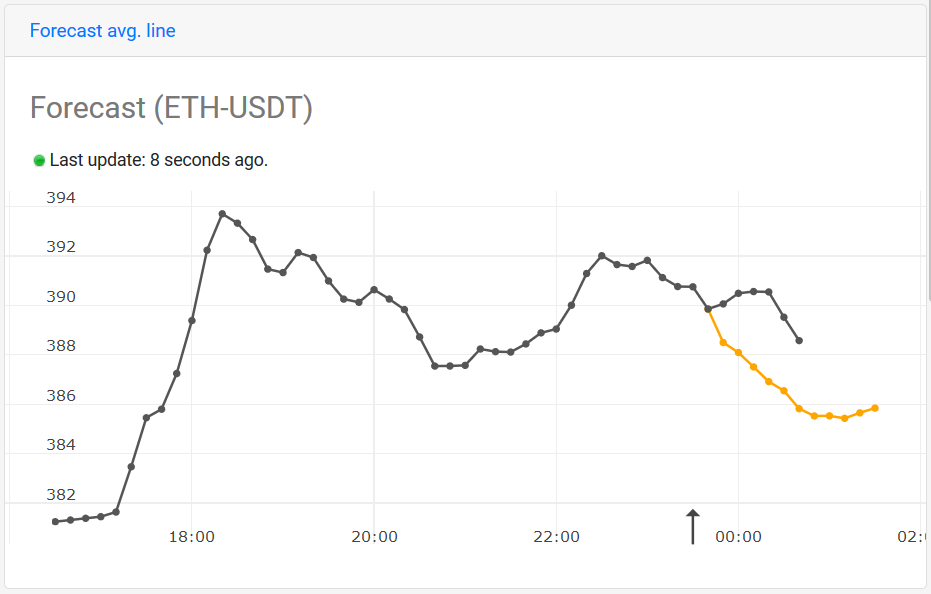
As I kept stepping through the intervals, the system remained very persistent, it kept predicting that the price would go up after 21:00 — you can clearly see its relentless guts on this chart:

1*62O-qlwMbtg5bil0GR1acw.png


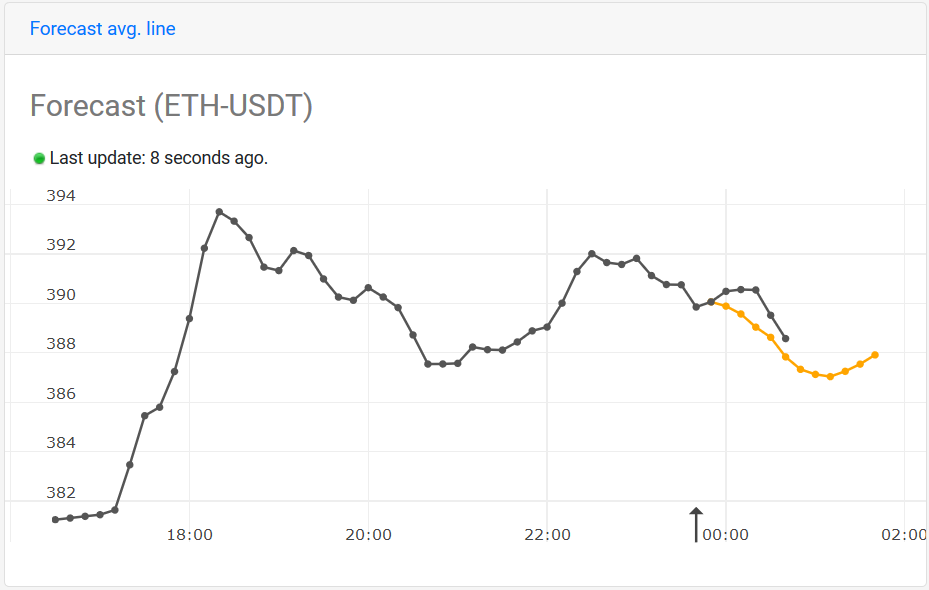
There was no increase in ETH’s price as indicated by these predictions, at least not until 22:30 as you can see on the next chart. But even then, this increase was much lower than predicted on the chart above. However, we again see the power of an AI system, which has learned/adapted and eventually made a much more accurate prediction:

1*CEB4tsjRyQKaIrJD3hVFqQ.png


Bitcoin
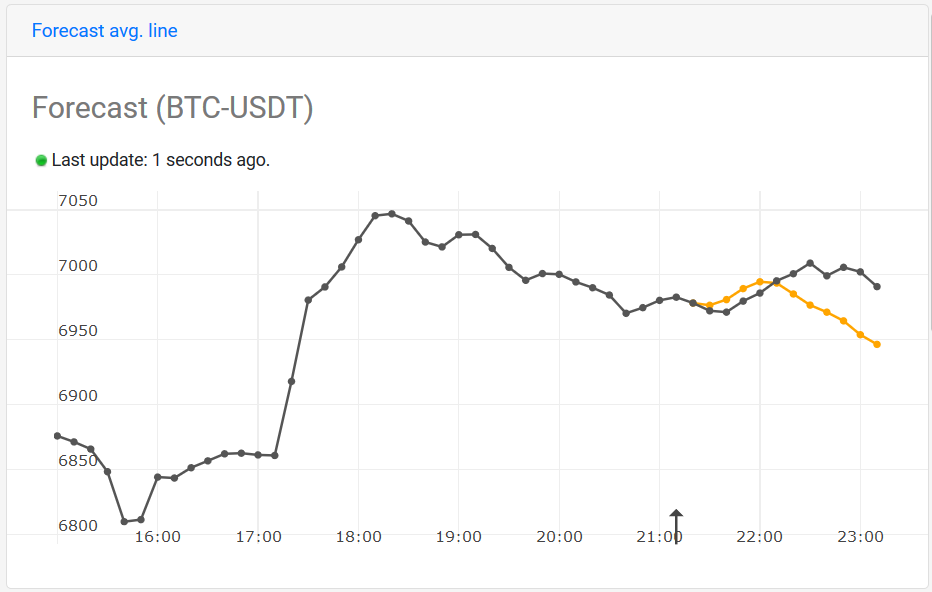
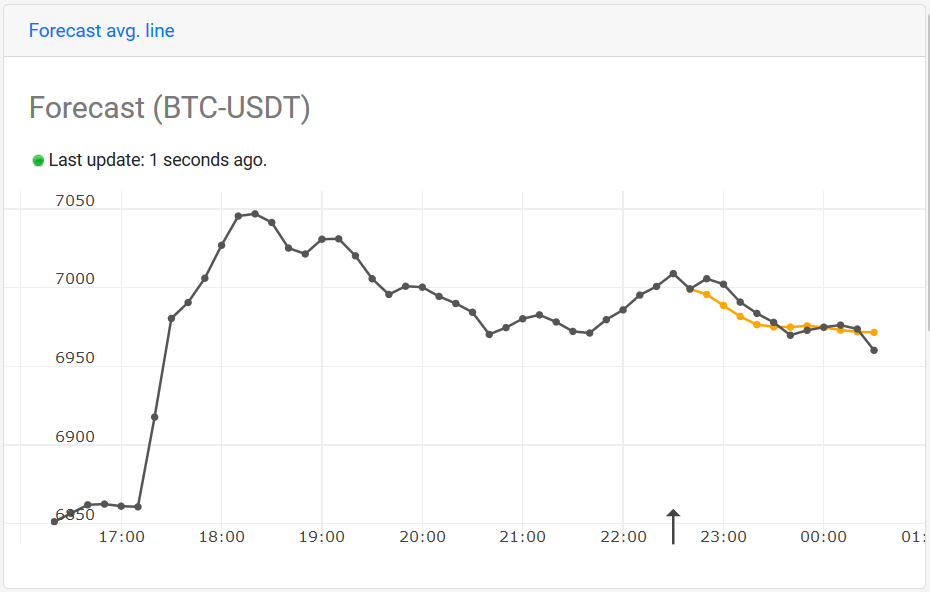
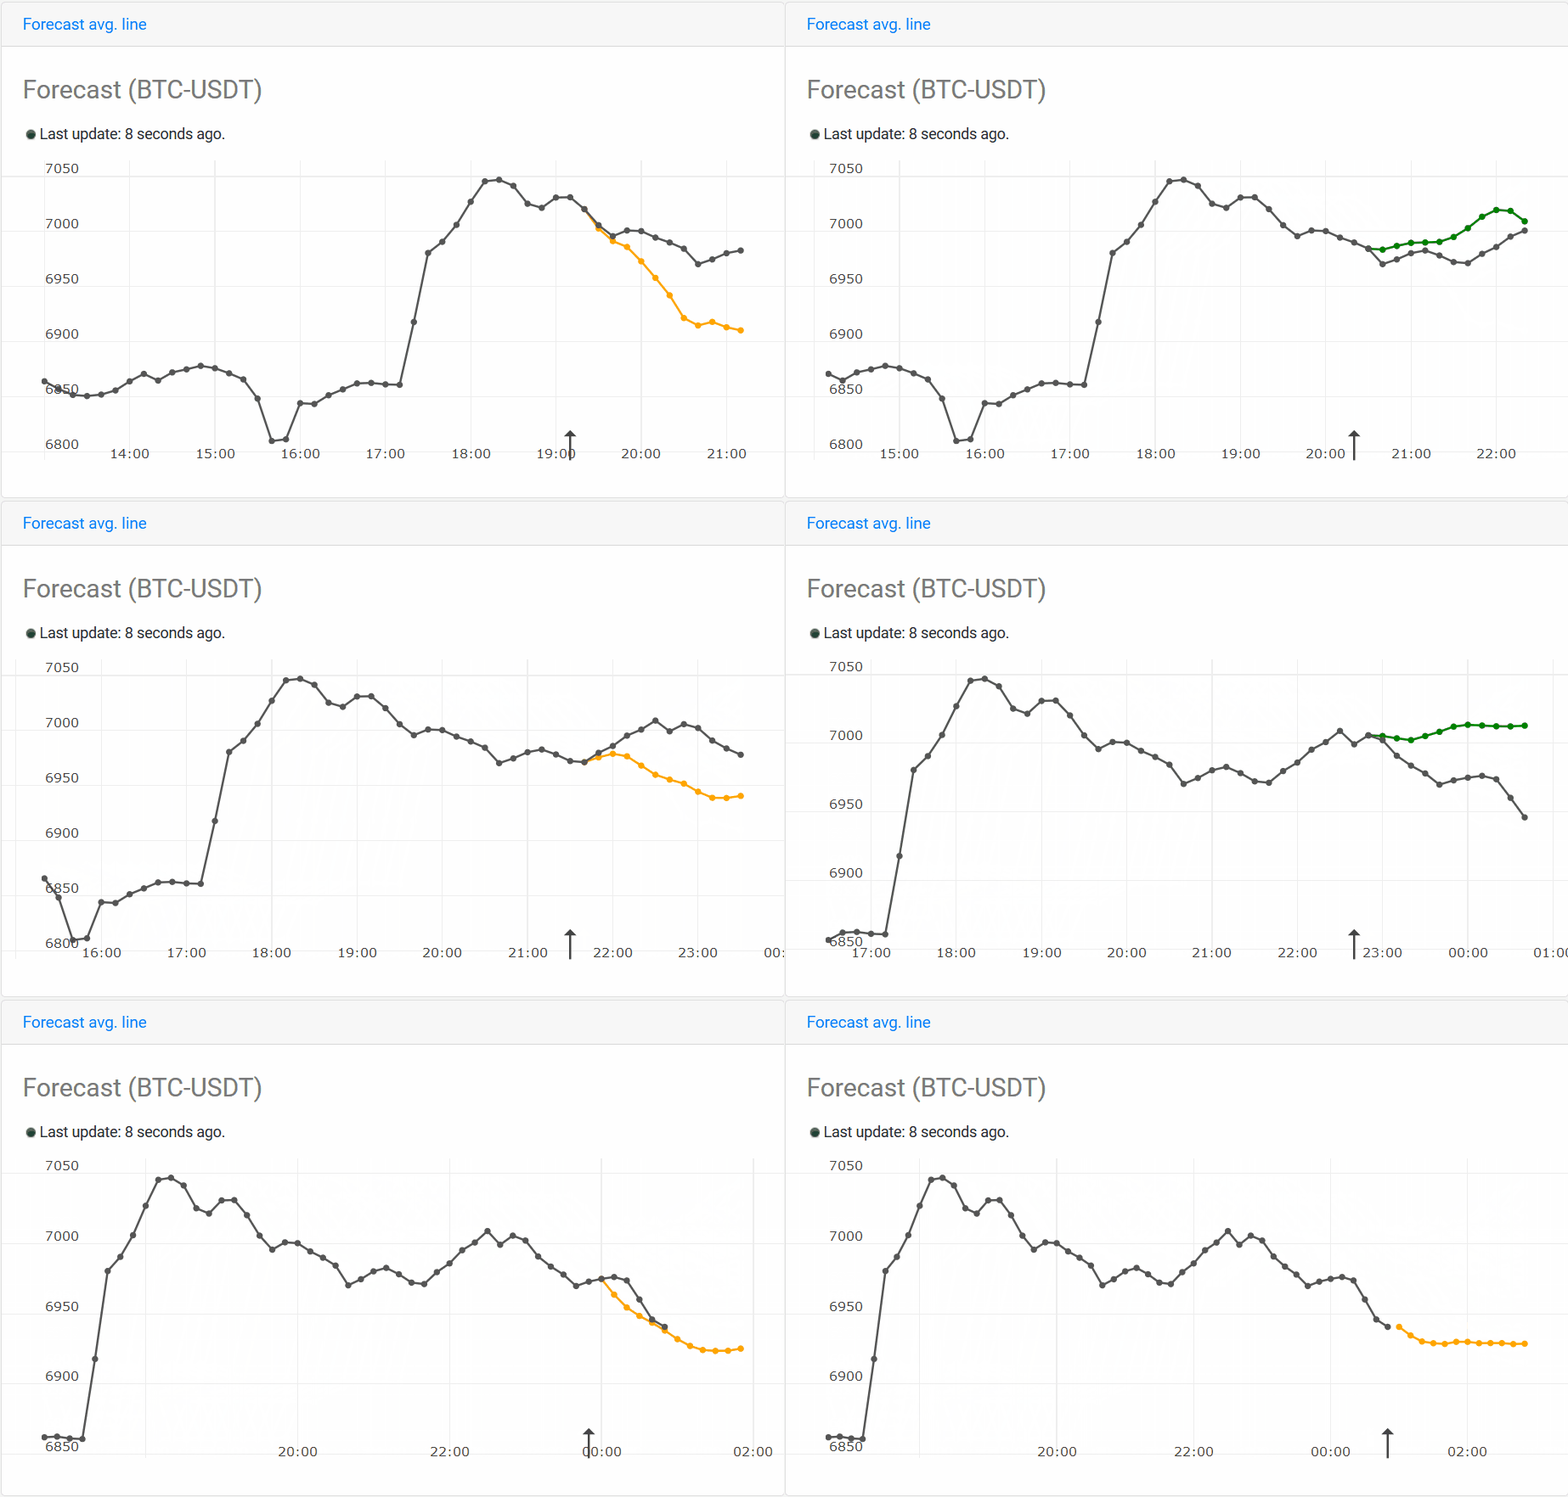
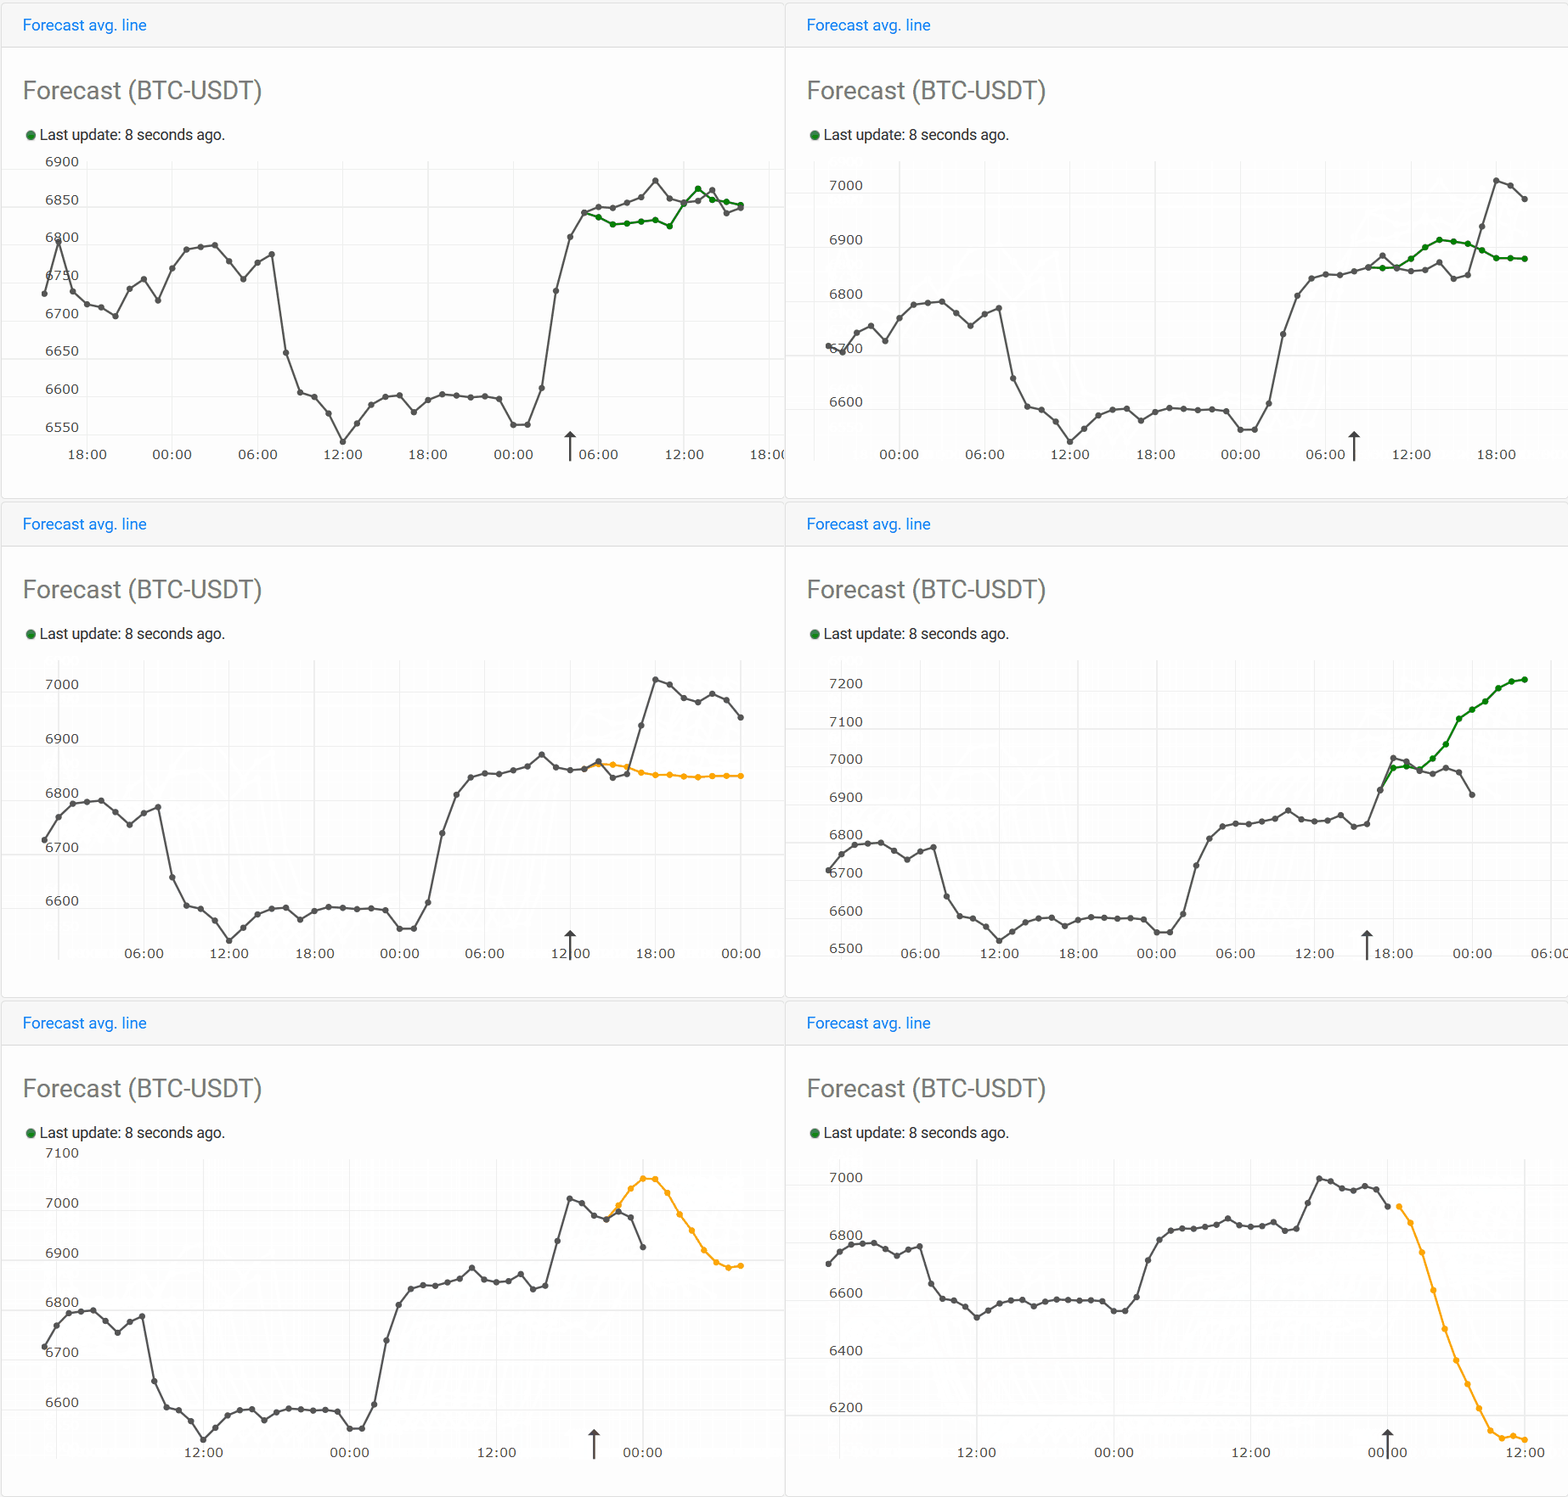
Both Ethereum and Litecoin appear to be no different than Bitcoin when it comes to making predictions. The same logic and reasoning applies. However, I do believe that the predictions will be more accurate for some coins compared to others — with Bitcoin being definitely not the most easy one. Have a look at the next chart and prediction:

1*Sv1RuziZNVor63BBLc_Ysg.png


The above has a pretty accurate prediction of the price going up for about five intervals, and then it predicts a decline at 22:00. In reality this decline did occur, but it took several more intervals — once again the system isn’t that good at predicting “when” something will happen, but it does a great job at telling us “what” might happen.

1*t176UdFlMLHn7X_eM7yDVw.png


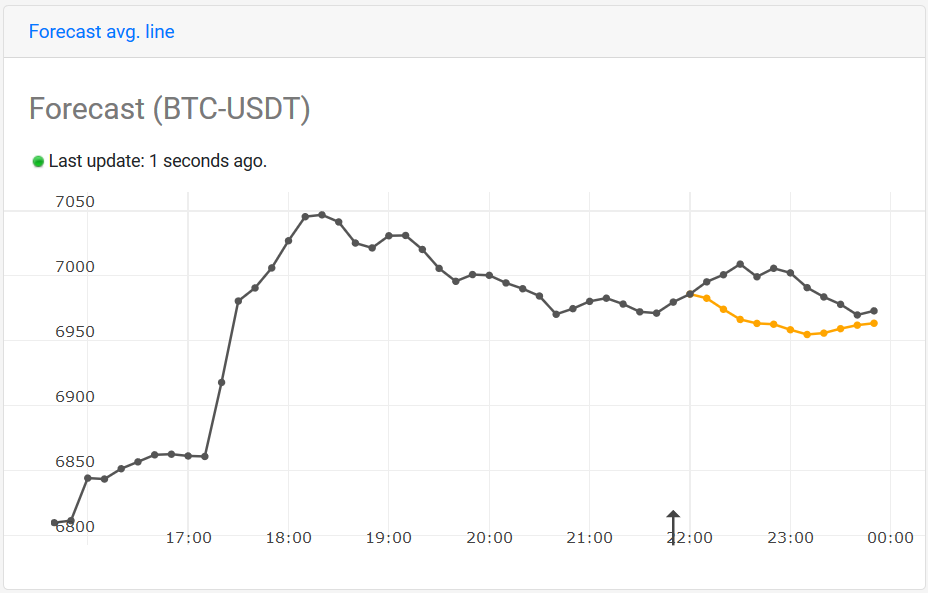
Stepping a few intervals ahead, I noticed that the system remained persistent in the sense that it still predicted the price to go down at 22:00; but the decline did not occur until 23:00. However once the market has reached a local max, as shown on the chart below, the prediction became pretty accurate.

1*uycYIRdE7Af1icLM6IYrkg.png


Summary
Reading a blog post while also trying to make sense of the charts isn’t the easiest way of consuming good content. So to recap I have generated animated GIFs that show the predictions at every step/interval as discussed above.

Litecoin:

1*KIViLJ504fJ6u1o89rmjZA.gif


Ethereum:

1*a8IBabrPUVtyie2ofYyeJg.gif


Bitcoin:

1*3Q4G9VM1TgKyVVz_JOzi8Q.gif


In all of the above we have used 10-minute intervals, as an extra I have also generated animated GIFs from charts with 60-min candlesticks:

Litecoin:

1*4e_JF091SoqY8EwPzDh-qQ.gif


Ethereum:

1*hHAHABHdRRcgAY4W-vXraw.gif


Bitcoin:

1*azb9YJJsMDetxhrniXf6aw.gif


Did you notice how accurate some of the Litecoin and Ethereum predictions were? Then also try comparing them againstthe Bitcoin predictions. It appears to me that ETH and LTC predictions (at 1-hour intervals) are way more accurate than the BTC ones. However, this is not a statistically proven/validated statement, and we have only analyzed a tiny fragment of a large data set.

Final words
These data-trained AI systems are pretty complex. They are like a black box which we feed data into and then it spits out “something”. In some cases the output is surprisingly accurate, while in other cases it was way off. But the most important factor is that the system is continuously learning, and it’s also able to adapt/adjust itself very rapidly — i.e. it does not take many iterations before it “changes its mind”.

The most tricky part is how do we apply these predictions to actual trading? This is a topic we are continuously working on and are making decent progress. Stay tuned for the next episode.

Thank you for reading and have a great day! :)
- Ilya
 
A profitable Litecoin trading strategy
Trading cryptocurrencies is a relatively risky business. Because of their instability and high volatility people consider trading crypto more like a gamble than an investment. There is actually a lot of science to it, but without applying some math and statistics your trades remain no better than tossing a coin.

Why Litecoin?
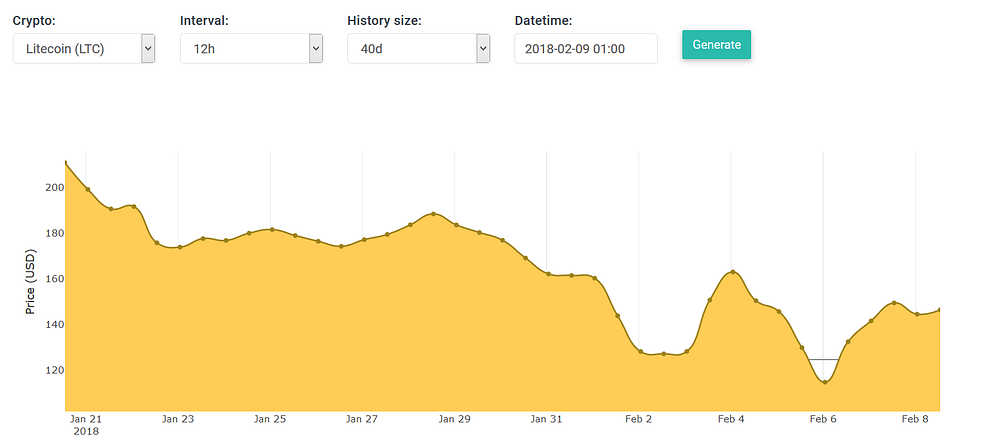
In this article I will specifically focus on the Litecoin cryptocurrency. You may ask why Litecoin? The reason is that I don’t want to analyze and discuss more than one coin here otherwise it will become quite confusing. But there’s also a second motive which is explained by looking at the following chart:

1*PSizhmdTWU1oSmbogqNUSg.png

Litecoin’s average price (21 Jan. to 08 Feb.)

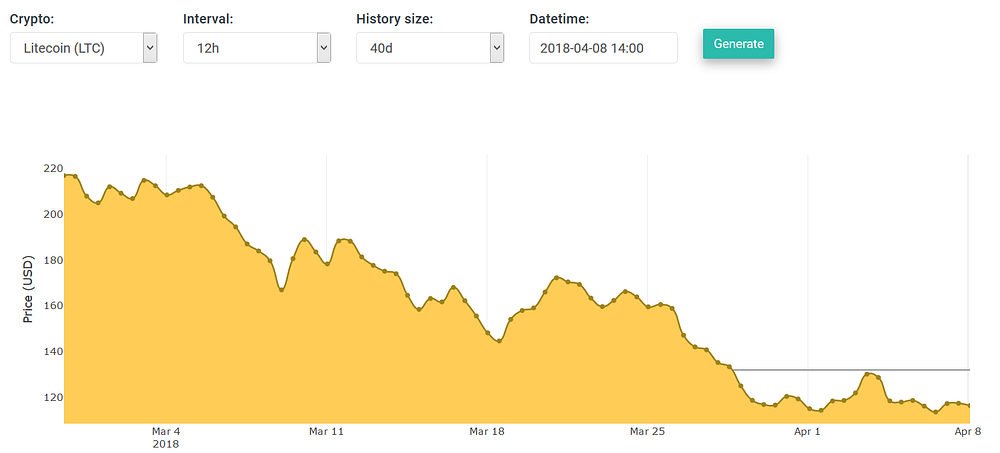
This chart shows Litecoin’s price from end of January to mid February. We see that Litecoin’s highest price was slightly higher than 200 USD — and its lowest was about 120 USD. Let us now skip forward to April:

1*kjqzQpP7xA_6X0UM9vfZYA.png

Litecoin’s average price (27 Feb. to 08 Apr.)

This time we see a quite similar situation when it comes down to the highest and lowest price of Litecoin: its maximum was slightly higher than 200 USD and its minimum is currently around 120 USD. It appears history has repeated itself. But the chart looks completely different, it looks more downtrend-ish than the previous one. Despite these differences there is a lot of money to be made trading on the LTC/USDT market.

The best time to buy & sell Litecoin
An amateur investor/trader who is risk-averse might look at those charts and stay away from this market, due to its high volatility and unpredictability. But to someone who knows better it’s a golden era full of opportunities.

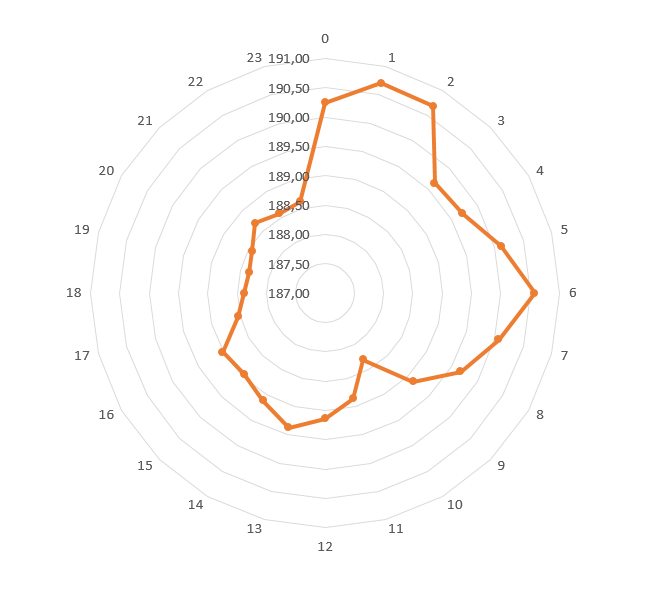
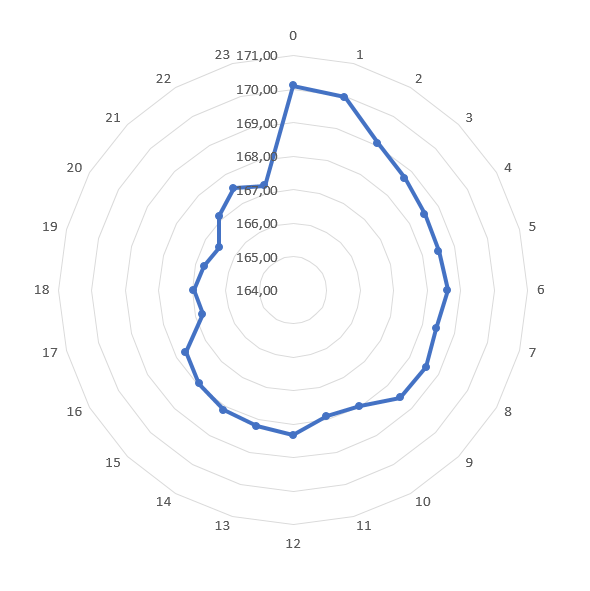
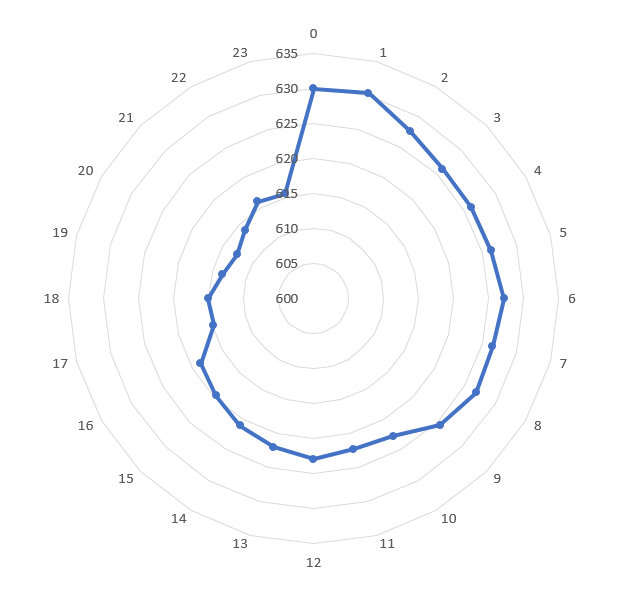
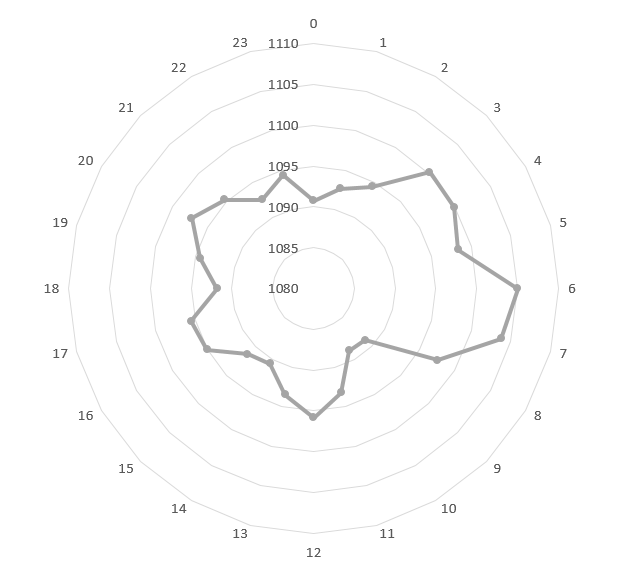
I computed Litecoin’s average price per hour, for the past three months (from 01 January to 31 March 2018). The output of my calculations is shown on the radar chart below:

1*uiGtScopdRUogAZHVwIkwA.png

Average price of LTC per hour (price data from Binance exchange).

Note: The labels on the outer radius are the hours in a day (0 to 23). The hours stem from the UTC/GMT timezone. The most inner radius displays the lowest price, the most outer radius is the highest price.

This is what we learn from the chart above:

  • One should buy when the price of LTC is at its lowest: at 10am (10:00) the price was between 187.50 and 188.00 on average.
  • Then one should sell when the price is at its highest: either at 1am or 2am the price is between 190.50 and 191 USD.
Given these two minimum and maximum price at their respective hours, we can compute the average return (ROI) by following this data:

ROI = (191–188) / 188 = 1.596%
This is a pretty good ROI that one can earn per day, since one will buy at the lowest price (i.e.10am), and then sell at its highest price (i.e. 1am or 2am). If one makes these trades every day for 60 days straight (starting from January), the compounded ROI will be: 154%. In other words, an investment of $1000 will turn into $2540 in just 60 days.

But don’t go all in and start trading Litecoin just yet. In this basic calculation we made the assumption that we have a daily fixed/guaranteed ROI. In reality it is never so, and most often than not people lose money in trading. There are two primary reasons for this:

1. Changing market
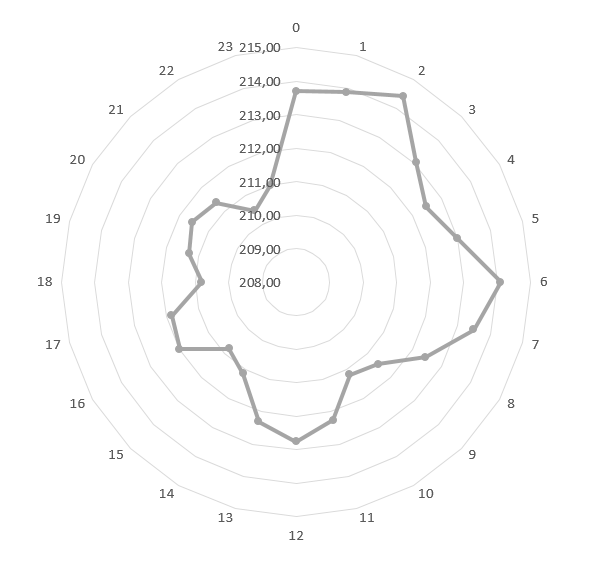
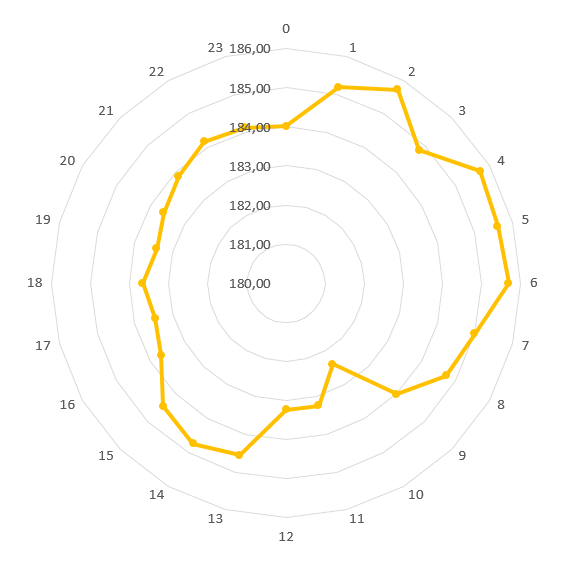
First, the market is always changing, our hour-to-price mapping is just an “average”, it was so for the past 3 months but won’t necessarily remain so tomorrow or next week. To illustrate this, let us compute the same hour-to-price mapping radar charts for each given month:

1*Gbl5dVjRTqj1aIf5rn1KxA.png

January
1*GazRm8Kax5NifwK7l67Lrg.png

February

1*fBFKb4QTdUjht9ZXsfiUmg.png

March
From these three separate charts we see that the highest/max price is not always at 1am (or 2am), In January it was 3am, in February there are several points (2am to 7am) and in March it’s dominated by 1am and 2am. But also for the lowest/minimum price: in January and February this was primarily dominated by 10am, while for March it is much more difficult to select one specific lowest point.

This is the danger of using “averages” in trading. They do allow us to explain and visualize data well, but it’s not always a good idea to use them for trading.

2. Low margins?
An average ROI of 1.59% per day, from day trading, is much better than many other investment strategies, but it’s still a risky one. In our initial computations we assumed an utopian scenario, while in reality the exchange is taking a fee on every trade you make (buy and sell). It’s not a large fee, usually about 0.1%, but relative to the ROI it is still a cut of 15.9% — this means the exchange is keeping about 16% on all your returns (whether positive or negative).

Back testing
Let us re-run our experiment by means of back testing the strategy, and this time including the 0.1% fee on every buy and sell transaction. In this experiment we shall buy at 10am and sell at 1am, which are the optimal points according to our 3-month average chart — we shall run this experiment over 3 months (January, February and March).

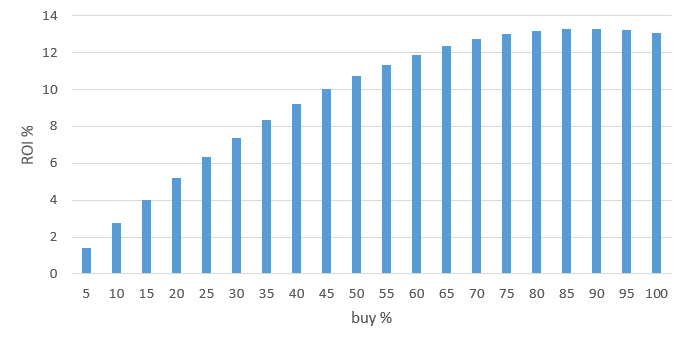
The ROI from the back testing results in 13.046% (89 trades in total) which isn’t bad at all, but is only equivalent to 0.217% ROI per day. Can we make this better? We certainly can! In this experiment we have let our system buy using 100% of our USD amount, this means when a buy trade is executed, it uses the full amount to buy LTC. So there is a high probability that it may have bought at a too high price. To minimize this risk and improve ROI, we shall use a lower buy percentage, such that it will only use an X% of the USD value to buy LTC. Our experiment uses 10-minute intervals, so at each new interval it will carry out a buy trade as long as there is cash left. But which value should we pick for X? 1%? 25%? We don’t really know, so the best way to find out is to try many X values and plot them out:

1*wUkEjGYSjijbQu7ocsPzCw.png

ROI % vs. buy %
On the above I’ve plotted out the X values on the horizontal x-axis, with its respective ROI from the back testing on the vertical y-axis. A buy rate of 5% is a very conservative/safe strategy with returns of about 1% over 60 days, so it’s very risk-averse, low ROI, strategy. While using a buy percentage over 45% yields an ROI of at least 10% over 60 days, but it’s also a riskier strategy. Despite the risk, it’s still a very nice ROI.

What’s the risk?
I have mentioned “risk” several times, how risky is it to buy Litecoin? The risk has been pretty low in the past 3 months, because the minimum and maximum price in January is somewhat in the same range as it is today (in March to April). So if you carefully take these extremes into consideration, all you have to do is wait for a good entry position, which is usually around 10 am, or between 9pm and 11pm GMT, and then sell at its highest point usually between 1am and 7am.

However, remember our first point that the market is always changing. These radar charts are true for their respective dates/months, but you may wonder whether they will also work in April, May and beyond? Yes, but they need to to be updated every minute in a sliding-window fashion. Such a system should have a much higher accuracy and ROI in theory, but I have yet to build such a thing to then test and verify its performance.

In the next posts we will carry out a similar analysis for Ethereum and Bitcoin. Thank you for reading and stay tuned!
- Ilya
 
A beginner’s guide to day trading Ethereum
Ethereum is the second most popular cryptocurrency right after Bitcoin. Every day hundreds of thousands of Ethereum tokens are traded, which is equivalent to an average of about three to four hundred million USD (every day!). Because of its size and popularity it remains as unpredictable and volatile as Bitcoin itself. But fortunately for us there is quite some science behind day trading crypto, which allows us to make better calculated decisions.

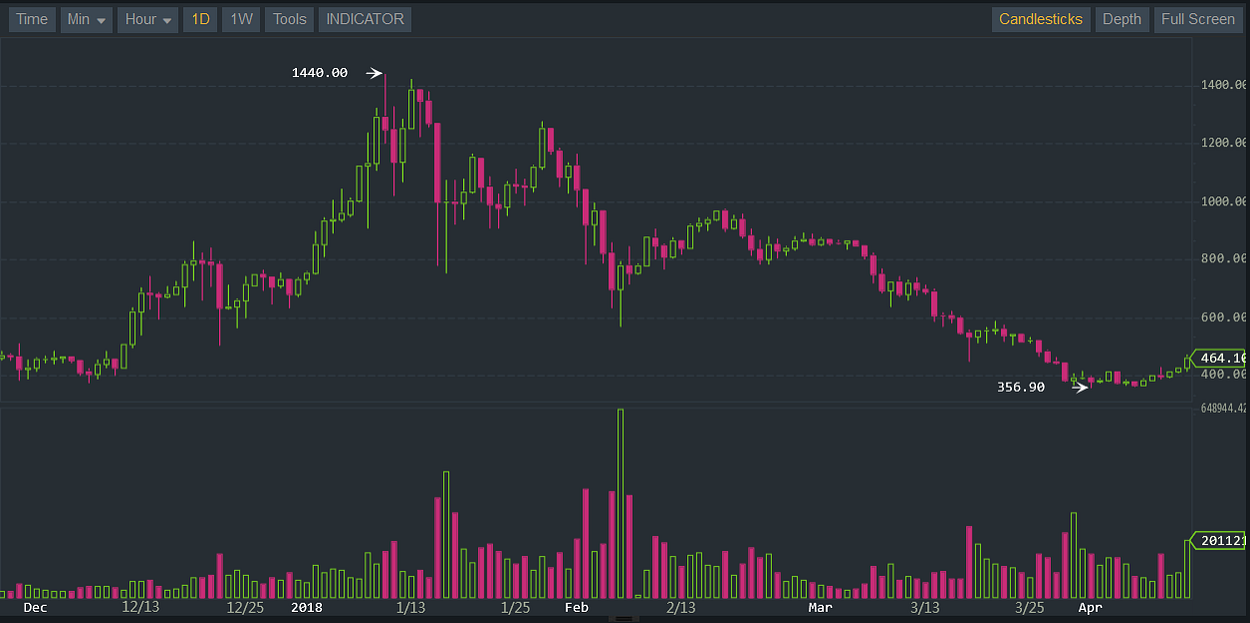
1*ef0yqPfboEHgOeSgtZEWOg.png

ETH-USD market snapshot from Binance with hourly candlesticks.

From the candlestick chart above we clearly see how Ethereum went from its highest peak ($1440/ETH) in January to just above $450/ETH today. Despite its decrease in value, there is a lot of money in this market that one can take advantage of.

When should you buy and sell Ethereum?
In our previous post I have made a similar analysis for Litecoin (LTC). As I was preparing this analysis for Ethereum, I have noticed several very interesting similarities between the coins. So if you haven’t read my previous post, check it out either now or after reading this one, the order won’t matter.

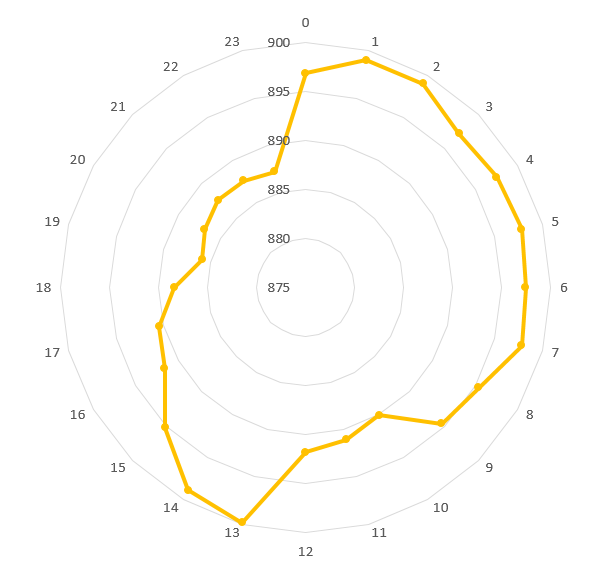
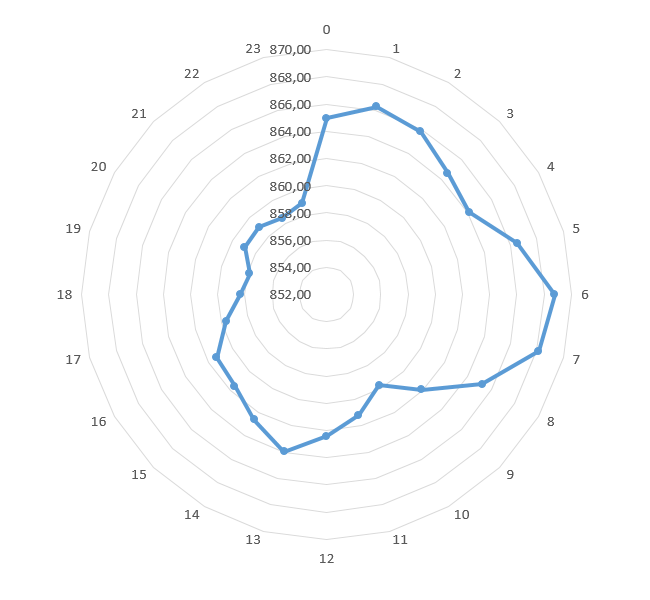
This is a basic analysis using basic math. But despite its simplicity it’s a pretty powerful one, and more importantly it’s so simple that our proposed strategy can even be learned by a child. This analysis is based on using the average price of Ethereum (in USD) for each hour of the day. The radar chart below shows how (on average) the price of Ethereum looked like throughout an average day — this data was constructed based on 3 months of data (January, February and March). The labels on the outer ring (0 to 24) represent the 24hours in a single day. While the rings/circles themselves represent the average price — notice that the smallest ring represents the lowest price ($852), while the outer ring represents the highest price ($870).

1*1rTQ9u4BuBMM_vsqsoYmTA.png

Per-hour average price of Ethereum over a 3-month period

From this chart we learn the following:
  • The lowest average price of ETH was at 19:00 (7pm) UTC/GMT.
  • While the highest was usually at 6am or 7am.
  • This hour-based price plot looks very similar to the one I’ve shown for Litecoin in our previous post.
From the chart above we learn that if we buy Ethereum at its lowest point and then sell it when it’s at its highest then we would make a profit. Let us calculate how much profit we’d make on average: The lowest price is about $858/ETH and the highest one is $868/ETH, thus the ROI from buying low and selling high is: ROI = (868–858)/858 = 1.16% . This means that if we follow this strategy, we would make about 1% ROI per day, since this data spans over 3 months we can calculate how much an investment of $1000 will be worth after 90 days: $1000*1.01⁹⁰ = $2448,63 — this is an ROI of 144.86%.

The reality is never as bright and simple, otherwise everyone would be rich and famous from trading crypto. The radar chart only displays the computed average price per hour of the day — but this does not mean that every single day the price will be at its lowest around 7pm and at its highest at 6am or 7am. Some days the chart may look completely different from the above, so one these days the ROI will be negative if one follows this strategy religiously.

What I am more interested in is back testing our strategy. Back testing is a way of simulating our strategy to mimic a real-life day trading scenario, including all trading fees. The end result from our simulation will tell us how much profit/loss we made. Since I have my own back testing code implemented I only had to adjust the trading strategy. The ROI from our strategy above (buy at 7pm and sell at 6am) resulted in an ROI of 22.10% over a period of 90 days (3 months), which is equivalent to an ROI of about 0.25% per day. This isn’t bad at all but way off from our theoretical ROI of 144.86% .

To understand why this more ROI is more realistic and way lower than the utopian ROI of over 140%, we have to break down our data into shorter periods. Instead of aggregating the data over 3 months, let us break it down per month:

January:
1*u2m_p8mgAV8RkfWPhi3K7A.png

January per-hour average price of ETH

February:

1*qMs_lnaBPq-PujTH1EJBfA.png

February per-hour average price of ETH

March:

1*j_oIjb-tb5x63ekjGhAVkQ.png

March per-hour average price of ETH

Once again the shapes of these graphs look very alike to the shapes for Litecoin on my previous post. However, let’s stay focused on the analysis — We see that the shape of each graph looks completely different, no month is the same. So our strategy of “buying at 7pm and selling at 6am” is not the most optimal one given any of these monthly graphs, because we can find a better strategy of when to buy/sell for each month separately. The reason for this is that the market is always changing.

Common sense
However, the strategy we used in our back testing yielded a positive ROI of about %22, in reality it could’ve performed much better if a human/person was making the decisions and using a tad of common sense. A knowledgeable trader usually doesn’t sell for an amount lower than what he/she bought for (except in some specific scenarios), but our dumb strategy has no other choice than to obey our orders.

Buy ratio
Another thing that influences our ROI is the “buy ratio”. My back testing strategy has a variable/parameter that indicates how much money (USD) it should use to buy a certain asset, which is Ethereum in our case. If it starts with $10k, then it has a choice whether to use 100% of this amount to buy ETH or only use 10% of it. In our analysis we have calculated the average price of ETH by the hour, but within a single hour the price can fluctuate quite a lot. By forcing our system to buy only at the very start of the hour may be a sub-optimal decision (this is when the buy ratio is 100%).

However, if we change the rate to 10% then it will only carry out six buys within the hour — the reason is that I use 10-minute intervals ; in this specific case the size of each step is ten minutes. Meaning, every ten minutes the system decides whether to buy, sell or do nothing. And for instance, if the the time’s hour equals to 7pm as in our case, this means it will initiate a “buy” order at that interval’s price.

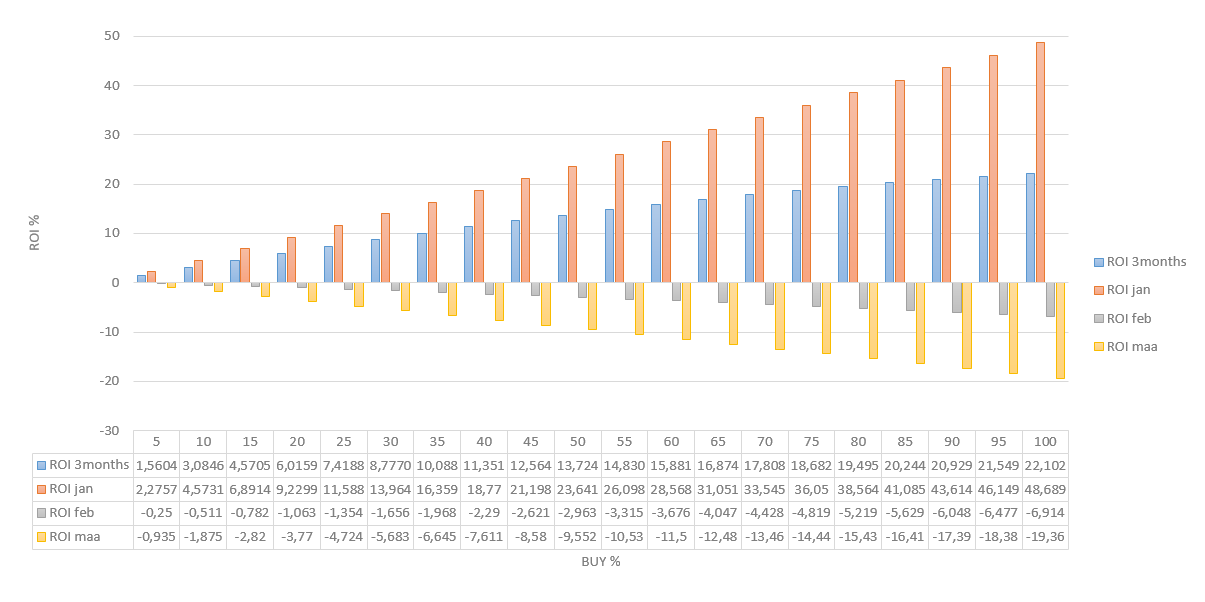
Once again (as in my previous post) we stumble upon the question of “what value should we choose for the buy ratio”? Instead of choosing just a random value, let us run the back test simulations for many different buy rates (starting at 5% up to 100%). On the chart below I have plotted out the outcomes:

1*sDvOn2onT4RPPSSZ-y4TgQ.png

ROI % (Y-axis vertical) return from the back test simulation versus the Buy Ratio % (X-axis horizontal)

On the chart above there are four distinct plots. There is one for each individual month (Jan., Feb. and Mar.) but also one for the 3 months all together. What’s interesting is that the ROI goes up as the buy ratio goes up. So in this case the highest ROI is achieved for a 100% buy rate. Which also kinda makes sense, because the more “buy” trades me make, the more trading fees we have to pay: for a lower buy rate we end up making more “buy” trades thus more fees.

Another interesting thing is that the only month where our ROI is positive is January, while February and March actually resulted in negative ROIs. This means our strategy would’ve worked in January but not in February nor in March. There is an explanation for this: in our 3-month price-by-hour chart, the prices in January were significantly higher than in February and March, so that’s why the outcomes are much more in favor of January than Feb./Mar — i.e. the strategy is biased towards January. To actually circumvent this problem one could compute the normalized price-by-hour averages for each given month, and then compute the average of these sub results. This is not something I’m going to investigate in this post but rather in the next one.

1*j_oIjb-tb5x63ekjGhAVkQ.png

Radar chart of ETH’s average price-per-hour for March.

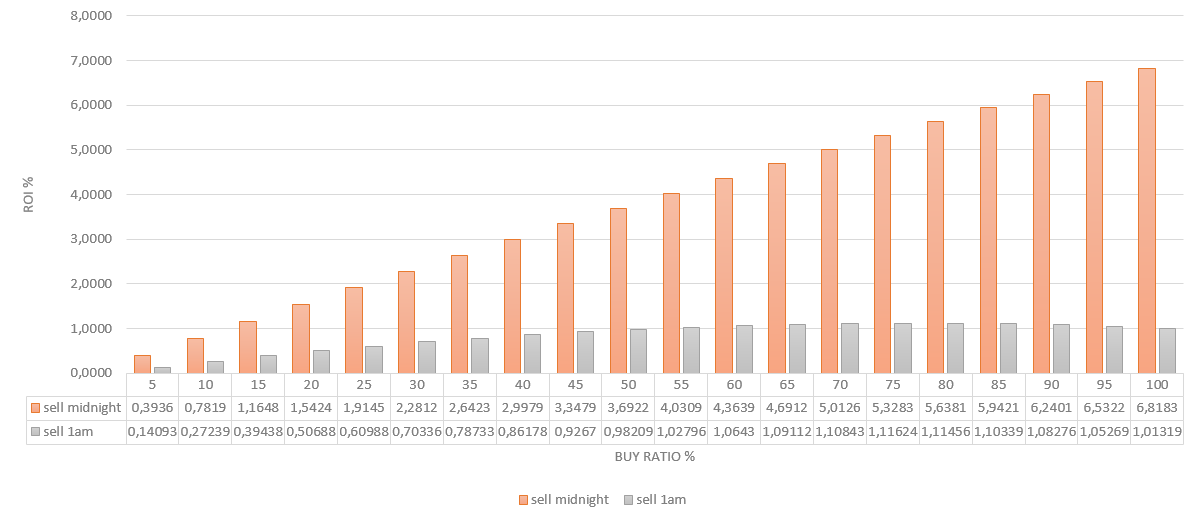
We can actually construct a similar strategy for February and March, and then make it ROI-positive by simply changing the hour of when it should buy and sell. To illustrate this, I have constructed a new strategy based on the average price-per-hour from March’s data — in this case it will buy at 8pm (20:00) and then sell at either midnight (0:00) or 1am (1:00). Have a look at these results below:

1*sLxwDHu-He5GsTaLNsdAgA.png

ROI % (Y-axis vertical) return from the back test simulation versus the Buy Ratio % (X-axis horizontal)

In the results above we clearly see that it makes a big difference whether to sell at midnight or at 1am.

Summary
We have learned that we can detect some daily and hourly patterns in crypto markets (Ethereum and Litecoin). However, due to the always evolving market these never remain the same. If you want to use these concepts in trading you then must have a system that continuously updates itself every single minute, like an auto-updating-radar-chart. But there is still a risk in using this strategy religiously — whatever happened in the past X days will not necessarily be useful for future decision making. In other words, this strategy has no future-predictable properties. It is however a really good strategy for a beginner to learn and use, because as we’ve proven through back testing one can make a decent ROI, but you should never rely on it exclusively.

Thank you for reading :)
- Ilya
 
Analysis of the crypto surge pt.1
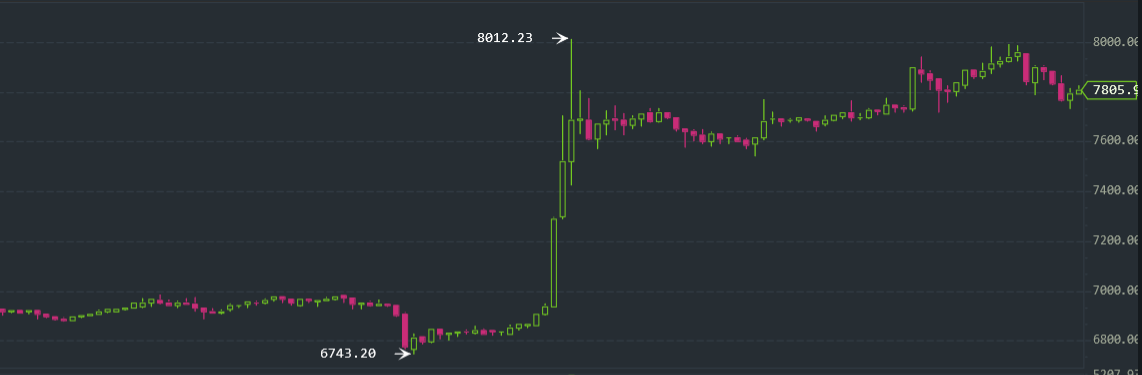
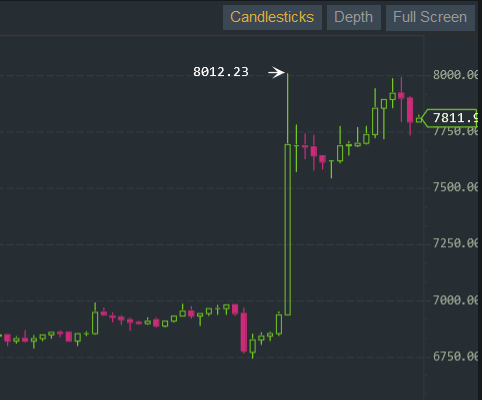
In the past 48 hours we have been very blessed because of the very fast growths of cryptocurrencies. For instance, Bitcoin grew by more than 10% in just 1 to 2 hours! This surge was not limited to the BTC-USD market, but almost every single mainstream market was affected.

1*-eewA8YRC6xst2TLIuRZVw.png

Bitcoin price surge as of April 12

More importantly, how did our A.I. system react due to these surges? As BTC’s price was going up and reached $7600, our AI system kept telling us that the price was about to drop again (back to $7400 and lower):

1*hETPwTme1DETmAsgk7rpjQ.png


But with each new hour it kept improving its output, as for many hours the price kept going up and stayed above $7500. Right now it’s well over $8000 — so the system has adapted itself and is making new predictions:

Hourly prediction (from an hour ago):

0*TuVRBsgmBDBiVcaN.png


These are 10-min interval predictions (so that’s very short-term):


0*Oxv-Y03IwznkOOyJ.png


Hourly predictions:


0*ad_9DvRdp0JyPVlE.png


As you can see, in the short-term the predictions indicate a drop, that is in the coming few hours the price may drop to ±$7800. But over the course of the day, that is the coming 12–24 hours, the price may reach a new height of $9000. I’m eager to see how our predictions shall evolve in the next 12–24 hours and how well their forecast shall be.

As mentioned in the introduction, this crypto surge is not limited to BTC, but almost every market is affected by this pump:

1*udyrllMp2hxVQQV1oqbdXw.png


1*PEai6OG45EJEI17XceajTg.png


Stay tuned for part 2! :)
- Ilya
 
Last edited:
Profitable Crypto trading strategies part 1: Moving Averages
In these series we shall explore and evaluate crypto trading strategies. Some of these will appear to be more lucrative than others. But we will also try to understand why certain strategies work in some scenarios while others do not. These analyses may serve as very important building blocks for developing even better algorithms.

Since this is the first part we shall cover an existing and widely known trading strategy which is based on computing and using Moving Averages of the price.

Simple Moving Average (SMA)
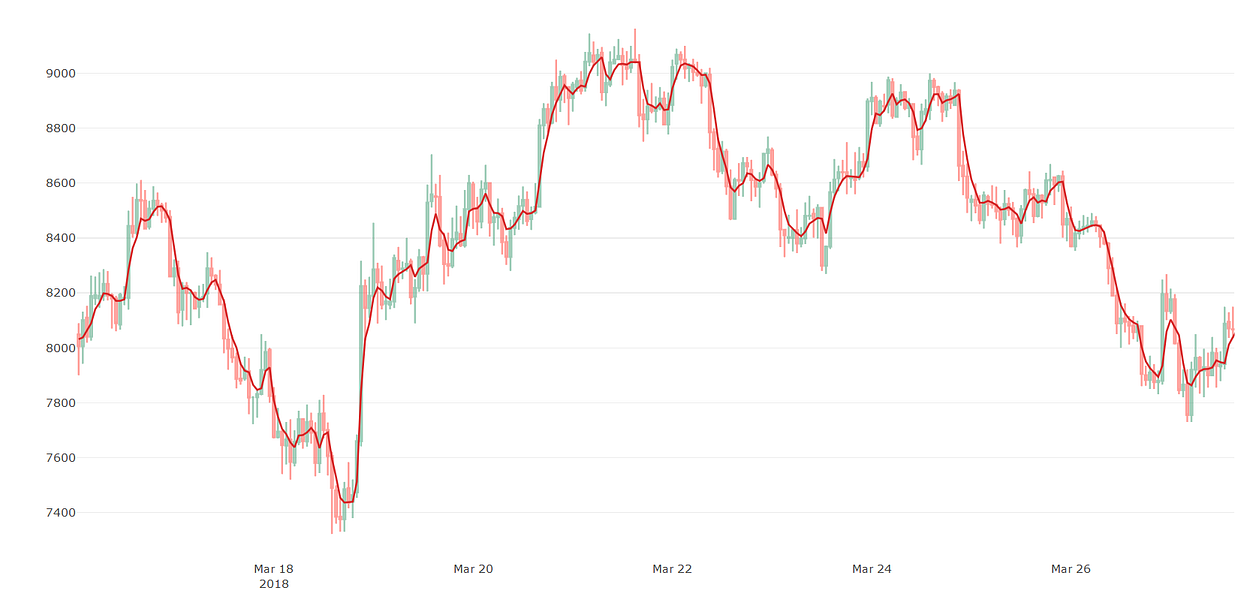
The moving average (MA) algorithm simply computes the average of a fixed number of historical price values. The end result is usually a smoother price line.

1*aHk513lfwnZer8KUQS8MNQ.png


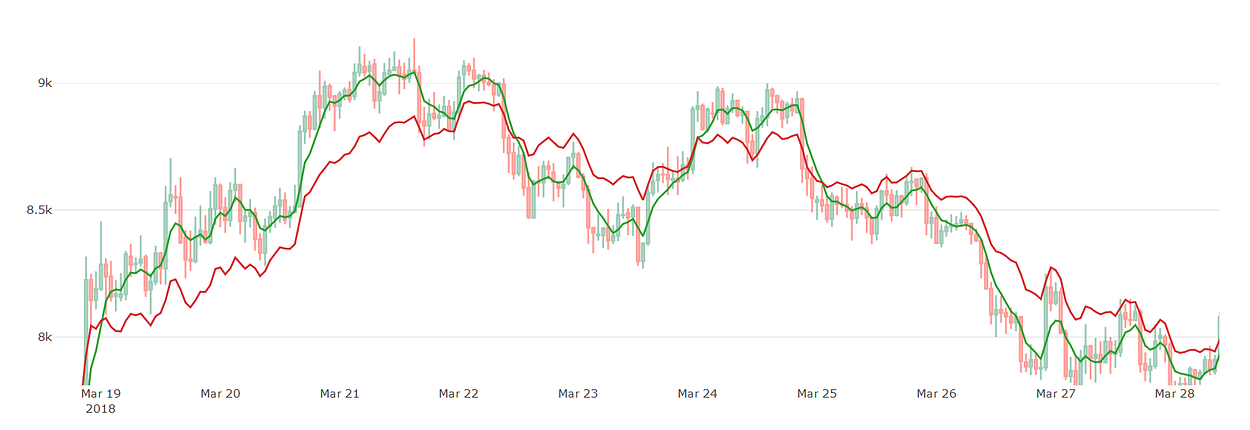
There exist quite a few trading strategies based on the moving average algorithm. One of the most popular ones is where two MA lines are created each of a different size — i.e. the length of the window of one line is greater/less than the other one. The end result consist of two lines, where the one with the largest window length (MA(L)) is smoother and less reactive to change — while the shortest one (MA(S)) is more adaptable and thus reactive to price changes.

1*DaQZu7dBgkJQfLU7sGWFjw.png


So how does one use this to decide when to buy or sell? The basic strategy goes like this:
  • When MA(S) goes up and crosses MA(L) it means “buy”.
  • When MA(S) starts going down and crosses MA(L) it means “sell”.
This strategy only has has two variables that decide whether to buy or sell. Because of its simplicity it usually does not perform well in a fully automated setting. The reason is because the MA lines are lagging behind the actual price. This can be seen by comparing the actual price against MA’s price when there price is rapidly going up or down, so the MA line can’t keep up.

Analysis
One may have a million views and opinions regarding these strategies, but how useful is SMA really? Let us simulate this strategy over 30 days, given 1-hour candlesticks and BTC-USD data from Binance.

But hold up, which lengths for the MA windows should we choose? To keep it scientific let us simply compute a whole array of different combinations… since my system generated several thousands of combinations with their corresponding ROIs (%), I am only going to show the most profitable ones in ascending order:

A: 1, B: 41,
ROI: 25.698181253856124

A: 1, B: 44,
ROI: 25.784055546042882

A: 1, B: 42,
ROI: 26.88308702794222

A: 1, B: 43,
ROI: 26.88308702794222

A: 1, B: 2,
ROI: 33.385980073927215

It may come as a surprise, or at least I was quite surprised, to see that the most optimal combinations consisted of the smallest SMA having size of one (=1). These results are biased towards the market in those 30 days, the candlestick interval size and many other variables. This means that using the MA(1) and MA(2) lines for trading has worked well (33% ROI) in 30 days from March 15th until April 15th. But there is no guarantee that it will perform better or worse in the next 30 days, next month or even next year. Because of this fact, it’s not recommended to rely on solely one strategy.

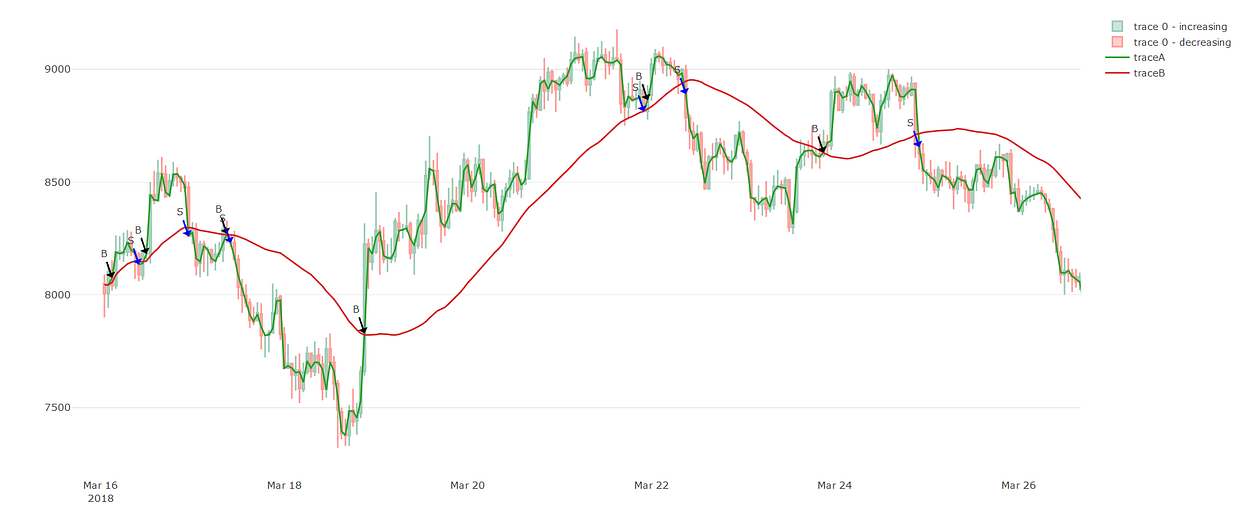
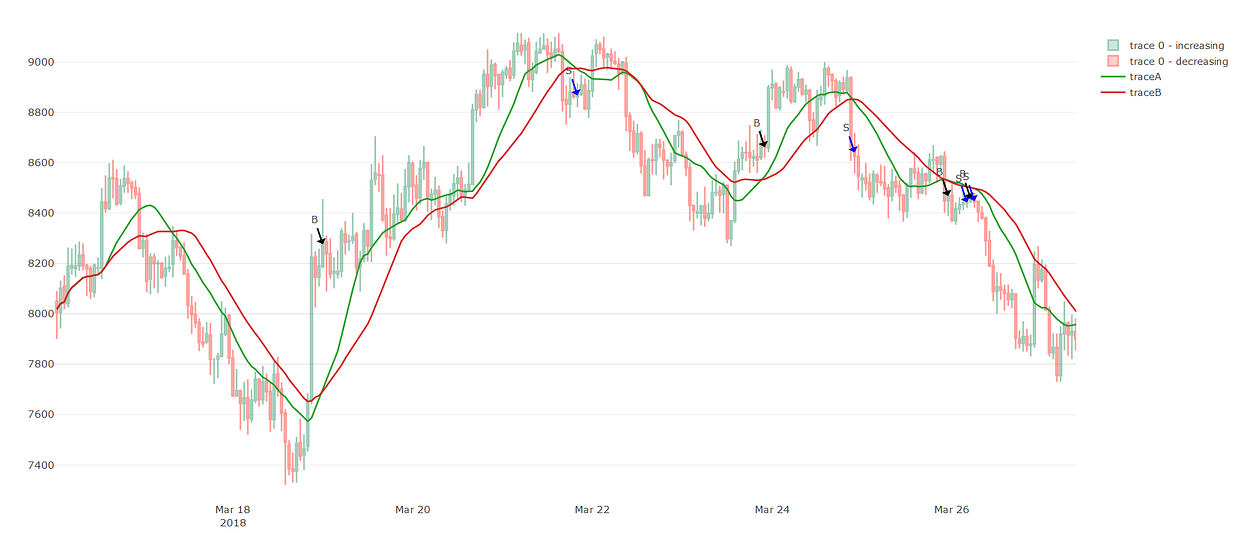
It’s also interesting to take any of these results and plot them out. Below you can see some of the buy/sell indicators given our strategy and the “A=1, B=43” parameters.

1*hBid4lmYsO8waw6iPeqtcA.png

Zoomed in on a specific region for A=1 and B=43

Notice the buy “B” and sell “S” signals indicated on the chart.

Why +90% of back testing is wrong
In the past as I was back testing and simulating strategies, I realized that over 90% of the data scientists and analysts were doing it “not good enough”.

To explain why: usually in simulations (back testing) people use the average of the OHLC values or OC values, or just the open or close prices. This will yield unrealistic results — for instance one’s simulation may indicate an ROI of 10% per month, however if the person deploys their strategy to an automated system he/she may end up losing -10% instead; how so? The reason is that the system will make sub-optimal buy/sell decisions. For instance, if in theory only the avg(OHLC) was used then the strategy will be biased towards chosen (hyper-)parameters, which in this case are the chosen lengths of the MA window(s).

To solve this problem, one has to compute hundreds if not thousands of simulations where each time one selects a random price in the OHLC or OC range. In my experiments using a random price from the OC range performs better than OHLC — the reason is that trying to catch some High or Low is a risky business and one should not depend on it. On the other hand, there is a much greater chance that an automated system will make a buy/sell decision within the OC range than the OHLC range, which occasionally for a majority of its range includes anomalic and short-lived price events. Even though this is a much more accurate simulation technique, it quickly becomes a major performance bottleneck as it will take many minutes (or even hours) to finish.

Analysis re-done
Because of these findings, the A and B parameters above are pretty much useless in real-time trading. They may work very well when trading manually, but if you plug them into a trading bot then it won’t be pretty. So to remove some bias from our analysis I had to use a random price from the OC range instead of a fixed avg(OC) price formula. But also simulate each combination multiple times to achieve statistical significance. As you can see below, the results are now quite different:

A: 14, B: 24,
ROI: 22.017287112622192

A: 15, B: 25,
ROI: 23.25290952665216

A: 13, B: 25,
ROI: 23.325239758631266

A: 16, B: 24,
ROI: 23.39638950525481

A: 14, B: 25,
ROI: 24.016091898867234

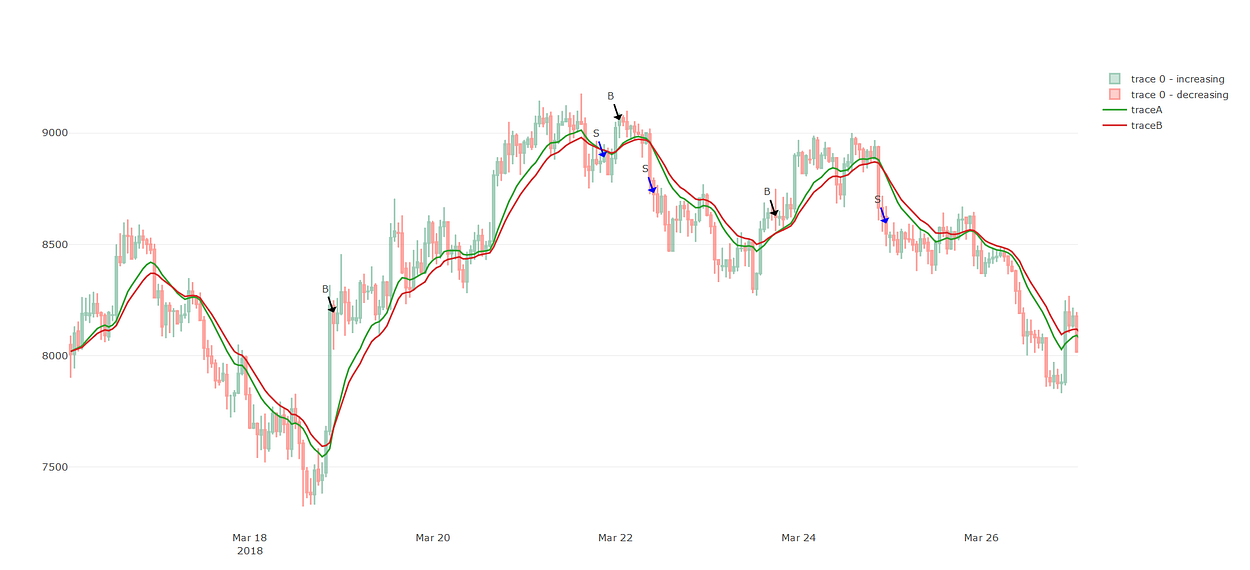
Let us now look at the same zoomed-in area but now given the parameters “A=14, B=25”:

1*e2X8_Rzkdx9X0Cl_ds-PsA.png

Zoomed in on a specific region for A=14 and B=25
Do remember that these parameters are still biased towards the state of the market (i.e. the chosen 30 day period). As we removed additional bias, we have made these parameters more reliable than the previous ones. But it still means that by using these parameters you may or may not have a positive ROI in the next 30 days. It’s important to note that by increasing the duration of the simulation to say 90 days may not always prove that your strategy will be profitable in the future. Some strategies may appear to perform terribly in the long run, but in the short-term may be profitable. That is why there is a bias towards the interval size of the candlesticks. In our case these were 1-hour, and so your strategy may work completely different had you chosen 5-min, 15-min, 30-min or 1-day candlesticks.

Exponential Moving Average (EMA)
EMA deals with the problem of lag in simple MA. What makes EMA unique is that it prioritizes the most recent prices over older ones. Due to this property it’s usually considered better than SMA, but is it really?

Single EMA
Once again below are some of the top performing parameters using EMA:

A: 14, B: 16,
ROI: 7.988283111833049

A: 14, B: 19,
ROI: 8.030809442935873

A: 1, B: 29,
ROI: 8.353365002653451

A: 1, B: 28,
ROI: 8.396721321117617

A: 12, B: 17,
ROI: 9.527662650735301

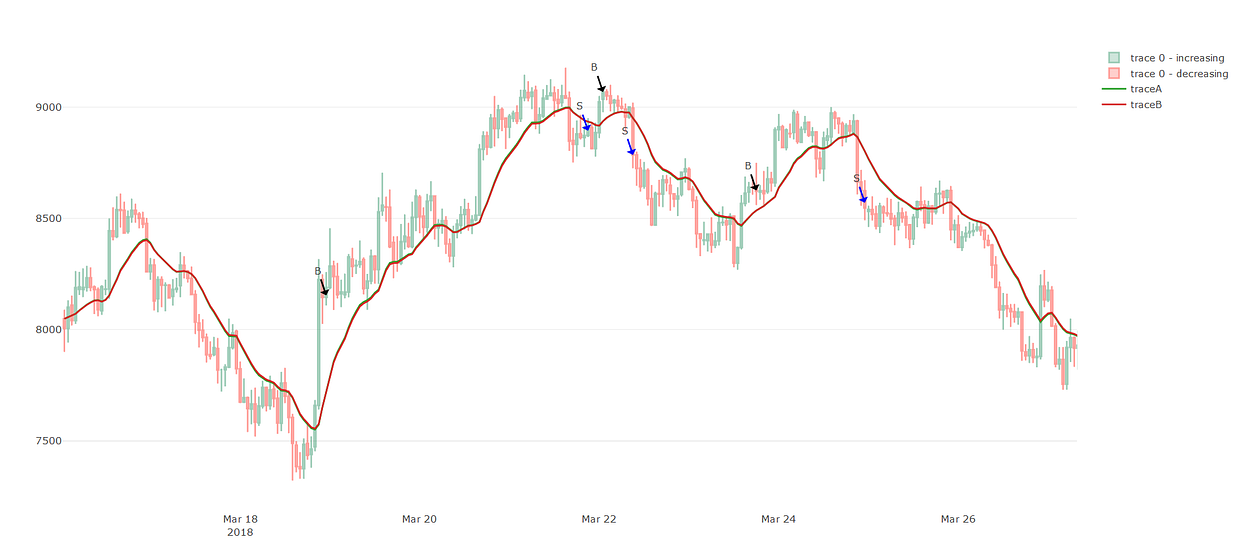
Let us again zoom-in on the plot given “A=12 and B=17”:

1*VOlQnWhqEuAAPNBliwbRMA.png

Zoomed-in to specific region on EMA strategy with A=12 and B=17
EMA did not perform any better than SMA in our simulations. But it does not mean that it performs any worse either. Our experiment is too simple to validate whether SMA is any worse or better than EMA. In any case, one should carefully analyse which of these two algorithms to use.

Double EMA (DEMA)
This algorithm uses EMA twice to make the data smoother and flatten sharp peaks. Some people claim his is better than single EMA, if so, how much?

A: 25, B: 29,
ROI: 2.755699995048543

A: 27, B: 29,
ROI: 3.4493373793213085

A: 26, B: 29,
ROI: 3.854505721112822

A: 27, B: 28,
ROI: 4.126830540081089

A: 28, B: 29,
ROI: 4.175496982585662

1*u1OfesATsJ3eqDYi53p2uA.png

Zoomed-in to specific region on Double EMA strategy with A=25 and B=28
Given our limited experiment, Double-EMA did not perform any better than single EMA. But then again, we don’t have enough statistical proof that it’s better or worse in general.

Summary
You may realize that developing automated trading strategies is a complex task for several reasons. First, it’s not enough to rely on just one heuristic or technique. Secondly, what works in one market may barely work in an another — I realized this when comparing BTC-USD with LTC-USD, as some of our strategies yielded much better ROIs for LTC than BTC, and vice versa. Last but not least, even though we do all the difficult analyses so you don’t have to, it is still recommended to do your own homework and to always remain skeptical of what you hear and read online.

Thank you for reading and definitely stay tuned for part 2! :)
- Ilya
 
Profitable Crypto trading strategies part 2: Prometheus
Prometheus is a Titan who stole fire from the gods and gave it to mankind. The name for this trading algorithm was chosen deliberately. It resembles what Prometheus did for mankind. In our case the “gods” are the market pushers or whales, while“fire” is represented by organized trading signals.

1*HWFvXBC9SKmfpFwUIcqa-Q.jpeg


Recap
In the previous post I have analyzed and discussed trading strategies based on the Moving Average (MA) algorithm. The problem is that these are pretty complex to optimize and even harder to automate trading with.

The gods
Crypto trading is well known for its volatility and instability. This may frighten casual investors, however, from instability can come great things. What I love about crypto is that it can grow by over 10% in matter of hours. Even though these events are pretty rare, there are plenty of smaller anomalies which we can leverage every single day.

1*G8-mH9mo-ee_QE8gQgnEOg.png

Bitcoin’s price went up by over 10% in an hour.
What causes these events? They are not random occurrences I can tell you, but they are the result of a closed group of individuals/companies who decide to buy or sell large quantities of cryptocurrencies at well orchestrated dates — as a result they have a strong influence on the price.

Stealing fire

Unfortunately 99% of us don’t have access to these exclusive and closed trading circles. Despite having no access, we can still profit greatly from these events. We do this by apply math and statistics to come up with algorithms that detect these anomalies and trade by them. This forms the basis for our Prometheus algorithm. The exact algorithm for Prometheus remains secrecy, but we are generous enough to share its results with you.

Prometheus 1.0
The performance of Prometheus varies depending on the market conditions as well as the interval size. Other than that it has only one hyper-parameter, while MA algorithms have at least two. Below are its ROIs from our back testing efforts — each back test consisted of 100 simulations where a random price from the OC range was selected. The tests were simulated over a variable number of days, but each spans until 18 April 00:00 GMT.

BTC-USD at 1-hour intervals
past 30 days — Average ROI: 16.43%
past 60 days — Average ROI: 48.05%
past 90 days — Average ROI: 183.67%

ETH-USD at 1-hour intervals
past 30 days — Average ROI: 34.21%
past 60 days — Average ROI: 62.22%
past 90 days — Average ROI: 309.67%

LTC-USD at 1-hour intervals
past 30 days — Average ROI: 35.70%
past 60 days — Average ROI: 105.75%
past 90 days — Average ROI: 608.31%

At first we did not believe these results to be valid. For many days we were skeptical and were looking for some bug or mistake in the algorithm. Fortunately enough we haven’t found it (yet), so through careful analysis of its trading signals we concluded that the results are valid.

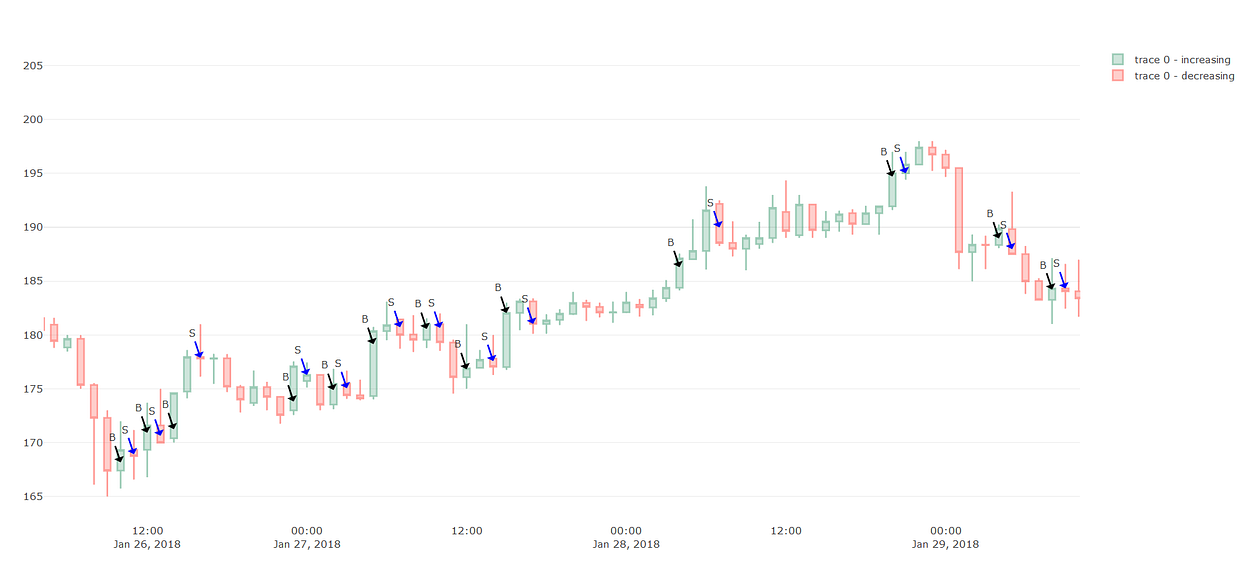
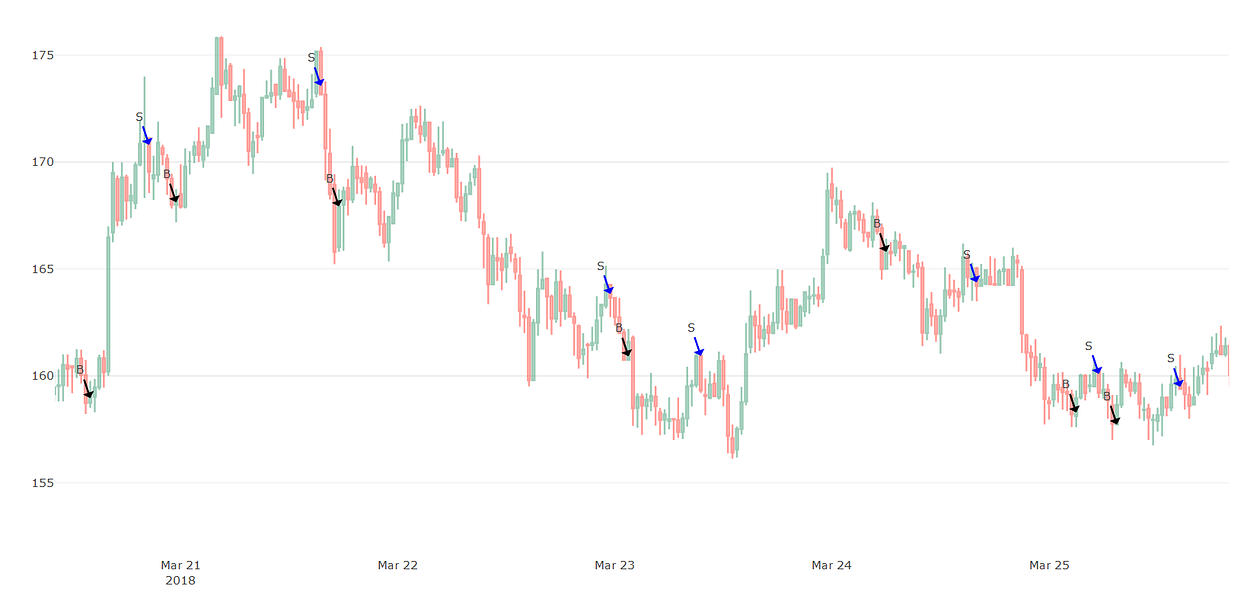
To illustrate why this strategy works so well, have to look at some of its trading decisions. Below is a chart that shows a portion of the simulated decisions made for the LTC-USD market by the end of January 2018:

1*sxtDxCBdDktUW_eUPs1K2A.png

Prometheus trading decisions for LTC-USD end of January 2018.
We clearly see that it made some really good buy and sell decisions. But you will also notice that they are not the most optimal ones either. This means one thing: this algorithm can be greatly improved and achieve even higher ROIs.

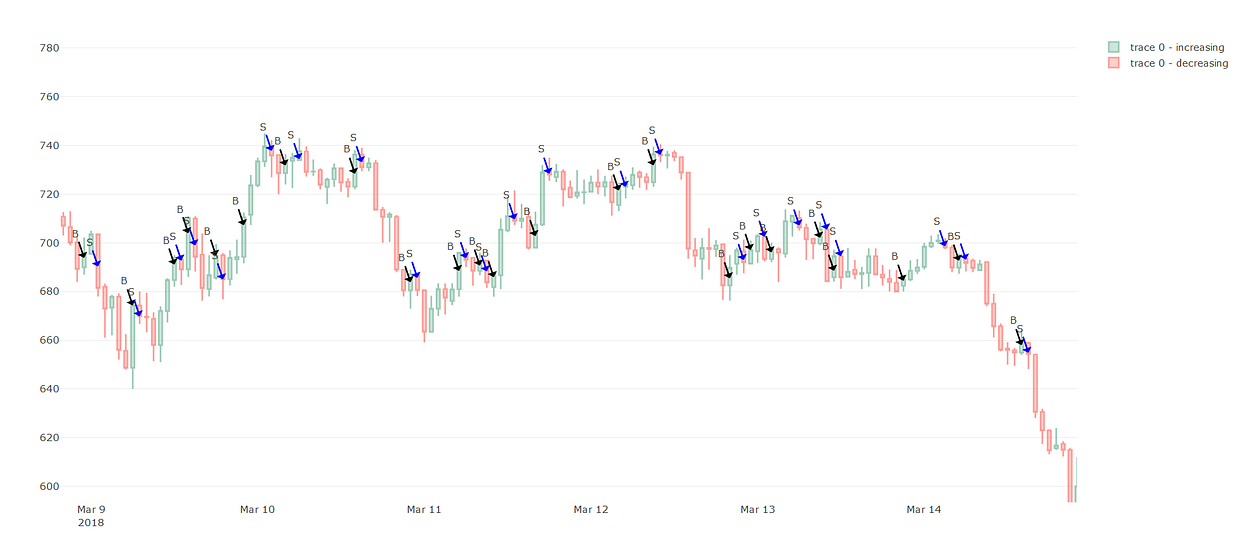
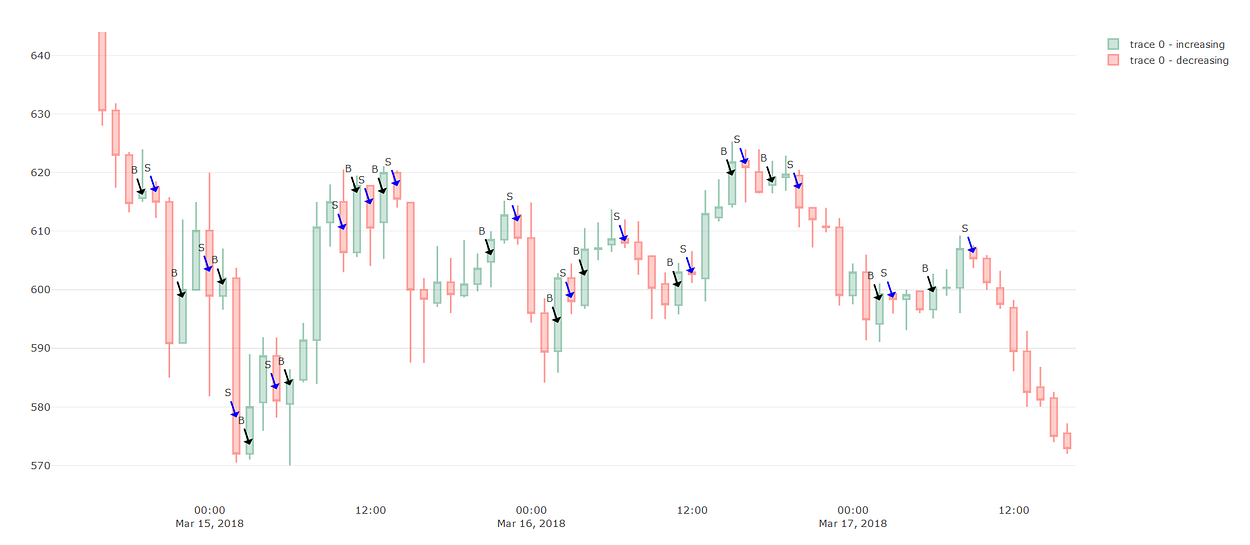
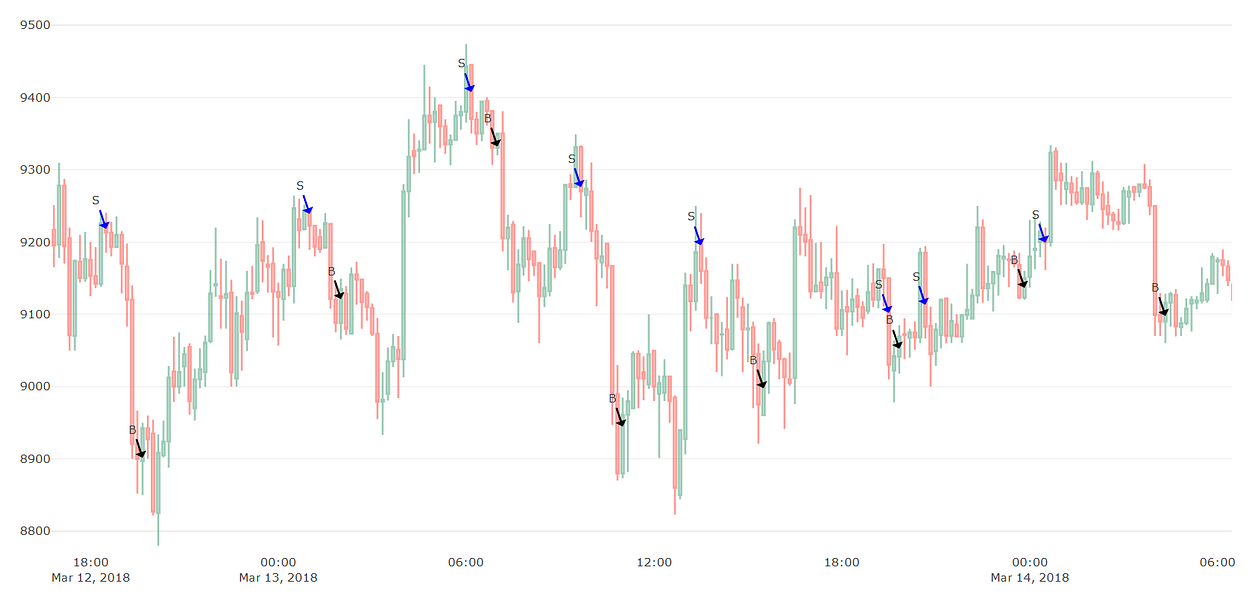
On the next chart we can see a portion of its trading decisions for the ETH-USD market from mid March 2018. Once again, not every buy/sell resulted in a positive profit margin, but overall the strategy works amazingly well.

1*voH9URmH9dATyfATLePNeQ.png

Prometheus trading decisions for ETH-USD for mid March 2018.

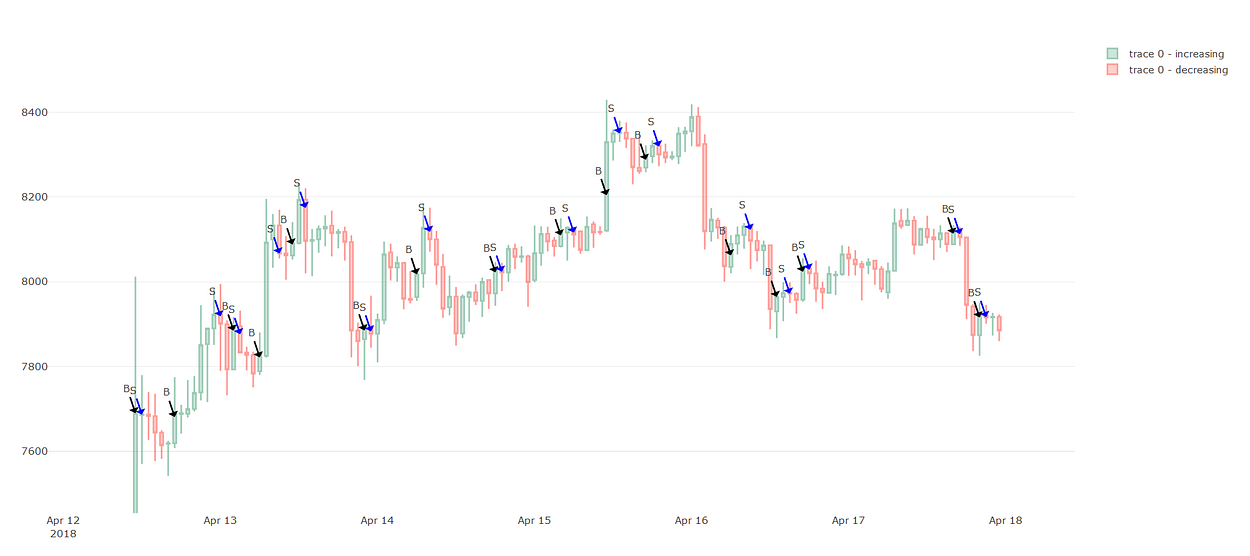
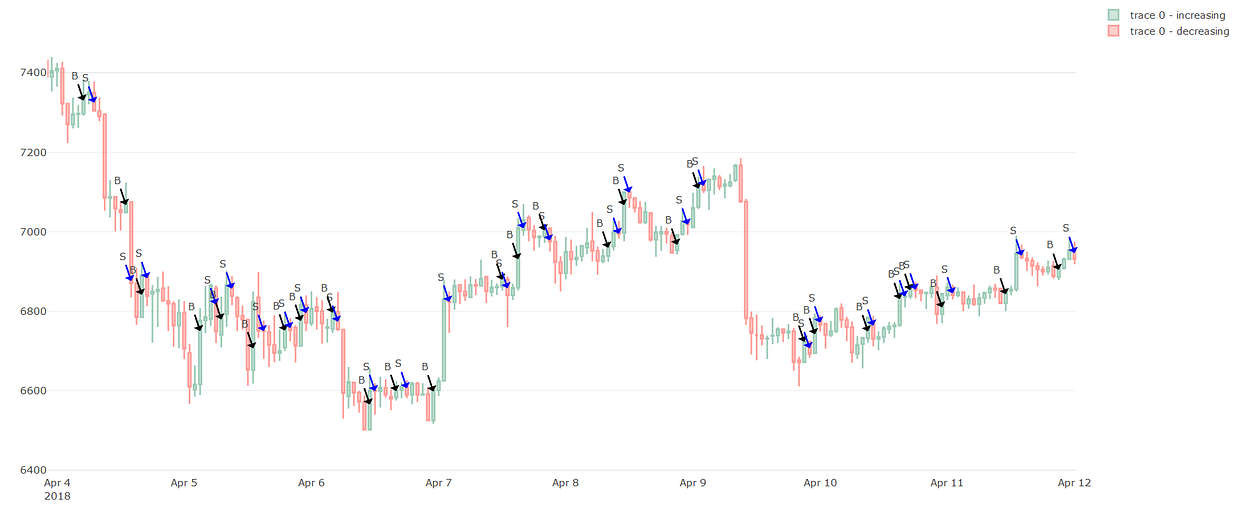
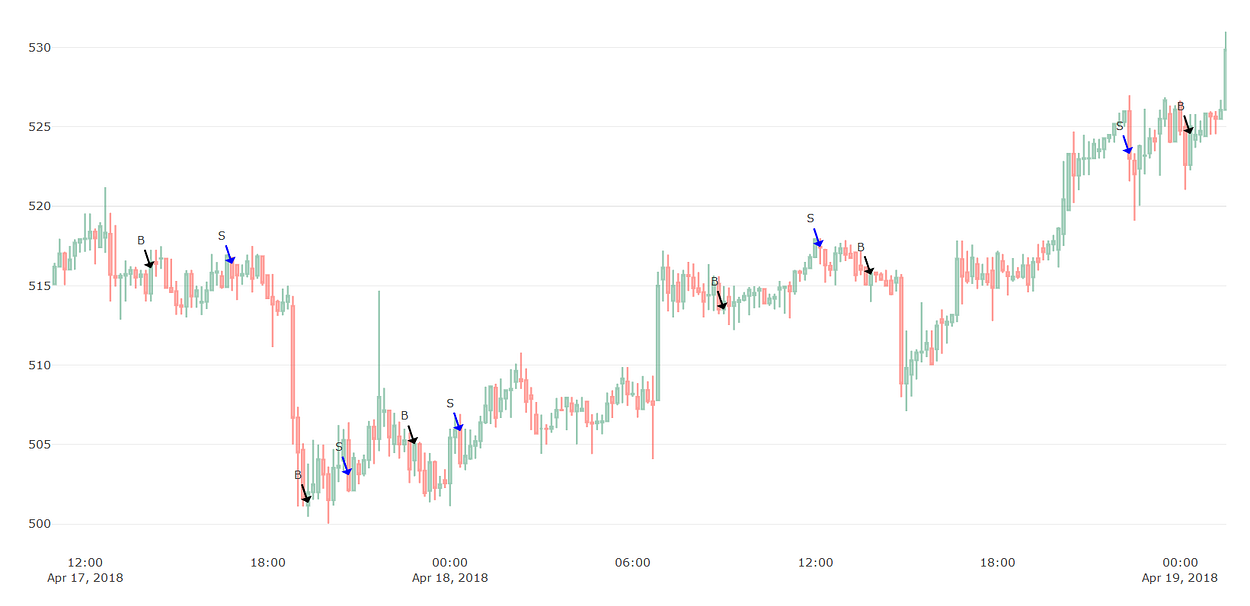
On the chart below you can see the trading decisions made at the BTC-USD market in April 2018:

1*XeMNsmHFmd32izT0iVsU_A.png

Prometheus trading decisions for BTC-USD for mid April 2018.
Prometheus 2.0
Despite the already terrific outcomes, as I mentioned, we keep improving Prometheus’ decisions. The second version of this algorithm only has a few minor changes but its results are already way better.

BTC-USD at 1-hour intervals
past 30 days — Average ROI: 30.25% (improved by 84%)
past 60 days — Average ROI: 88.52% (improved by 84%)
past 90 days — Average ROI: 406.67% (improved by 121%)

ETH-USD at 1-hour intervals
past 30 days — Average ROI: 61.11% (improved by 78%)
past 60 days — Average ROI: 19.21% (improved by 91%)
past 90 days — Average ROI: 693.13% (improved by 123%)

LTC-USD at 1-hour intervals
past 30 days — Average ROI: 48.13% (improved by 34%)
past 60 days — Average ROI: 159.28% (improved by 50%)
past 90 days — Average ROI: 1193.56% (improved by 96%)

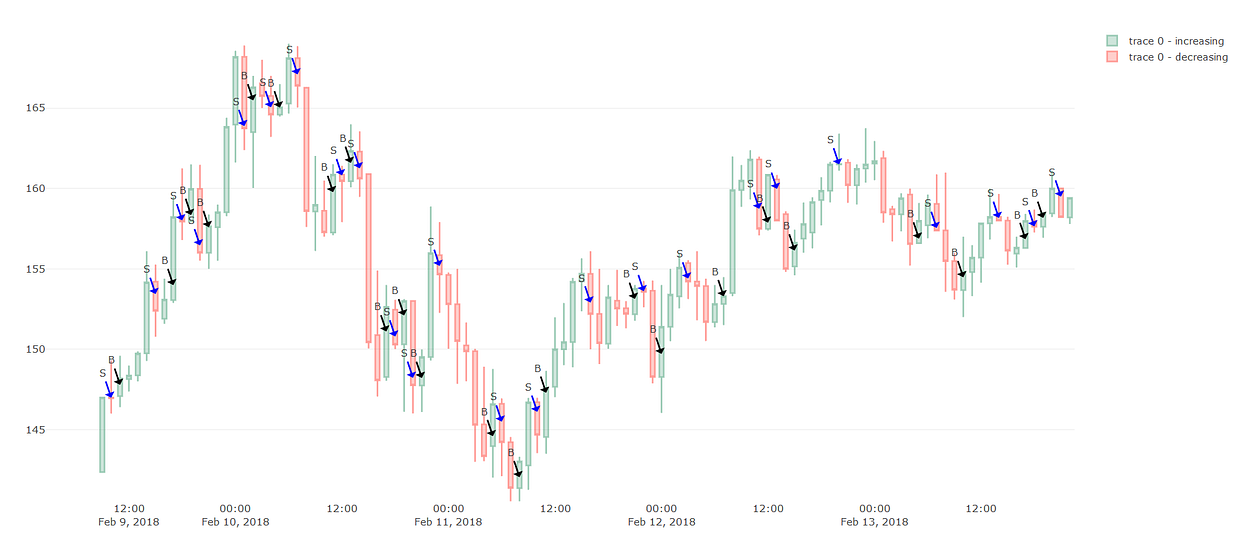
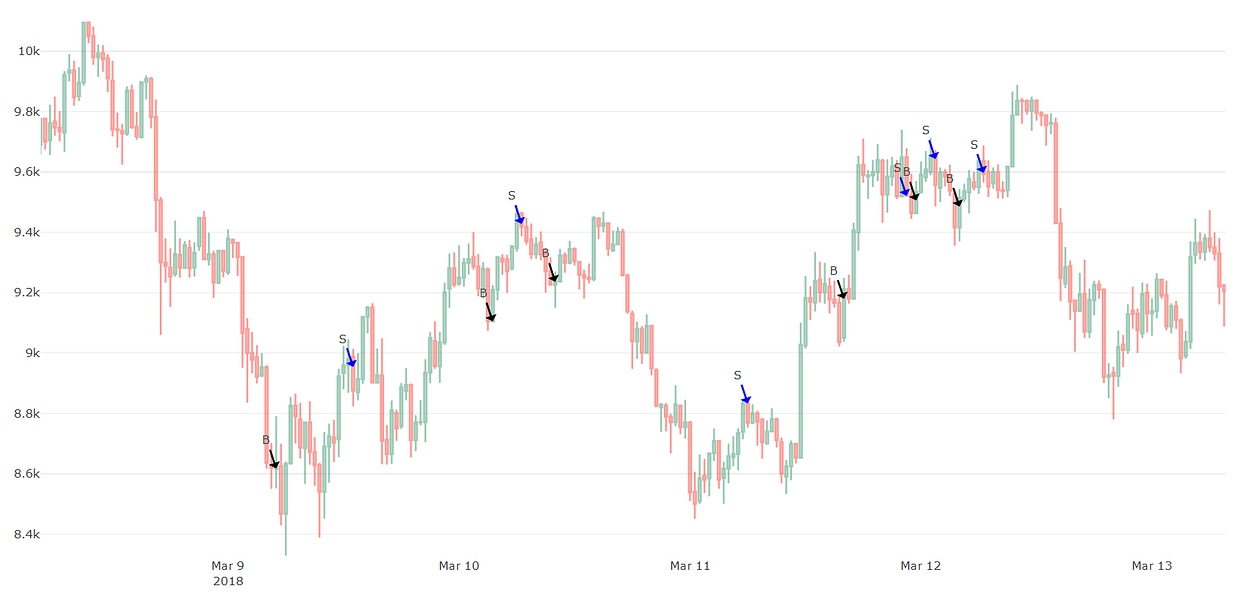
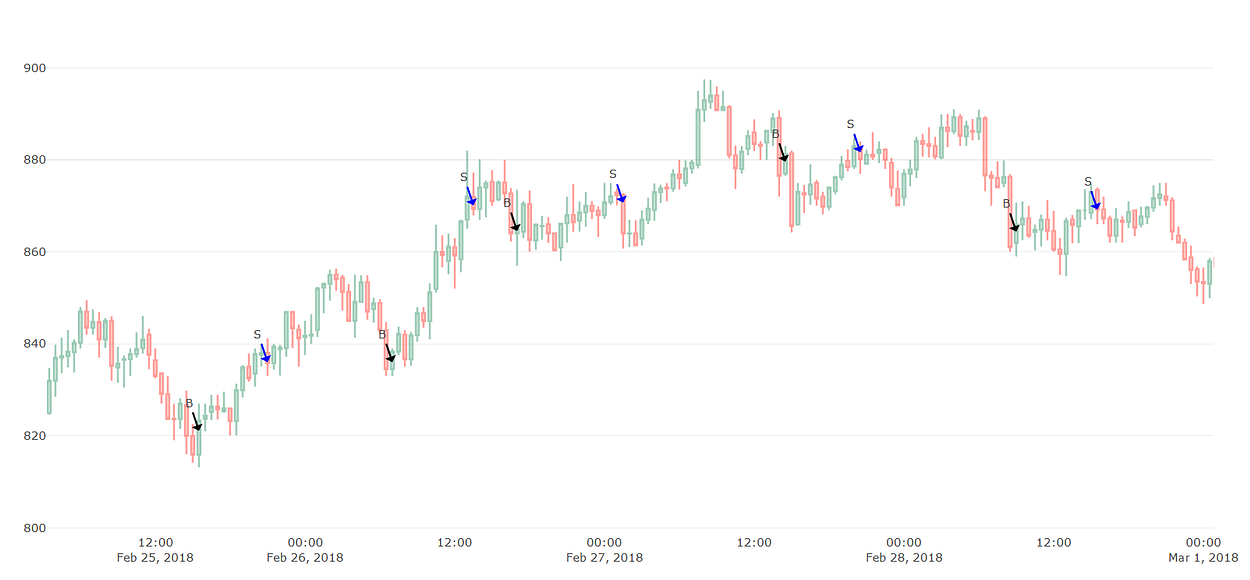
These results are galaxies away from well known trading strategies/heuristics such as those based on SMA or EMA. So once again, let us look at some of its decisions on the following charts.

1*3ANKP9iTXCE8lJss4qw_sw.png

Prometheus trading decisions for LTC-USD before mid February 2018.
1*doP03IABDNznC4D7omEXDA.png

Prometheus trading decisions for ETH-USD around mid March 2018.
1*JgVprlMeXb-hWv9905PmhA.png

Prometheus trading decisions for BTC-USD before mid April 2018.
Conclusion
These results are really amazing, but let me warn you to stay skeptical. I do not believe that this algorithm is production ready, thus it is not going to yield these terrific ROIs on autopilot yet — there are several reasons for this which we are still investigating. But the good news is that these trading signals will be available on our upcoming app, so you will be able to subscribe to these signals/notifications and trade by them.

Thank you for reading and have a great day!
- Ilya
 
Profitable Crypto trading strategies part 3: Pistis
The Greek spirit of trust, honesty and good faith is called Pistis. The trading strategy I am about to analyze and discuss below has been named after Pistis for one specific reason: it uses statistical proof, and since mankind puts a lot of trust in statistical models it makes sense to link it with trust, faith and honesty.

1*grLP-TEAZV-h2R8VrY8_Ww.jpeg


Recap
In our previous post we analyzed the Prometheus trading strategy. It performed exceptionally well for both Litecoin, Ethereum and Bitcoin. On average it performed much better for Litecoin than for the other two. There may be many reasons why that is so — since we are not academics (but business people) we are not going to waste any time investigating that.

Pistis 1.0
What makes this new trading algorithm unique is that it’s constructed purely from statistical equations and has no hyper-parameters to tweak at all. Let me first show the performance of Pistis for different market setups and then I will illustrate which decisions this algorithm makes.

BTC-USD at 30-minute intervals
past 108 days — Average ROI: 95.66%

ETH-USD at 30-minute intervals
past 108 days — Average ROI: 94.36%

LTC-USD at 30-minute intervals
past 108 days — Average ROI: 69.44%

We can already see that Pistis performs much better for BTC and ETH than for LTC — which is the opposite of Prometheus. But we also see that it performs much worse than Prometheus 2.0 for instance, which has over 1000% ROI in just 90 days. This is not a problem, we are not trying to compete with Prometheus itself, but can we do better? Let’s try a different interval size:

BTC-USD at 10-minute intervals
past 108 days — Average ROI: 216.00%

ETH-USD at 10-minute intervals
past 108 days — Average ROI: 232.36%

LTC-USD at 10-minute intervals
past 108 days — Average ROI: 330.37%

When using 10-minute candlestick intervals, the ROI/performance almost tripled. I have also tried other intervals such as 5m, 15m, 60m and 120 minutes but these ROIs were either close to zero or negative, these are thus not worth discussing here.

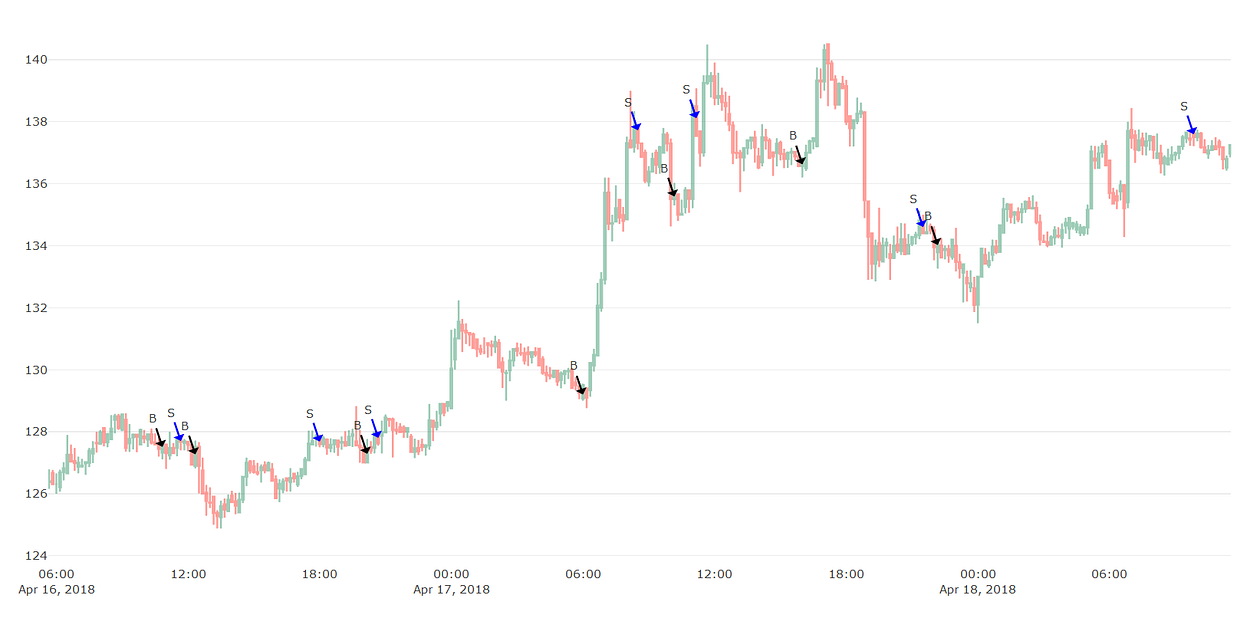
Let us have a look at the signals from this strategy. First come the 30-min interval based decisions.

1*UozwBivsl9QAYHUJLYQzpQ.png

Pistis for 30-minute intervals (BTC-USD)
1*jgbaBqXdNSEJWXrKBQjXvw.png

Pistis for 30-minute intervals (ETH-USD)
1*lhJZJKh_ovz_C5iuKXa0oQ.png

Pistis for 30-minute intervals (LTC-USD)
From the charts above we see that some buy/sell signals are not optimal at all, thus generating a loss. Since this is just the first version (1.0) of Pistis it is generating signals only based on one set of predefined rules. In later versions we can optimize and add more rules to eliminate many of these losing decisions. Let’s now peek at the decisions for the 10-min intervals:

1*1INAbddXCh92AT_RAaSC1g.png

Pistis for 10-minute intervals (BTC-USD)
1*eqJ-qKo4amtVUCPVQszq9A.png

Pistis for 10-minute intervals (ETH-USD)
1*_CC4dKVQnn7tir3UW_fnQw.png

Pistis for 10-minute intervals (LTC-USD)
We see that the 10-minute intervals also have some pretty bad buy/sell decisions as well. But its ROI is about three times as high. One reason for this is that with shorter intervals it’s minimizing the effect of the bad trades while compounding the good ones.

The ROI of Pistis is much higher for trading LTC or ETH than for BTC. I am wondering whether there is some other crypto market out there for which the Pistis strategy would perform significantly better than LTC. But that’s a topic for another day. For now all I promise is that Pistis signals will be included in our upcoming app.

Thank you for reading and stay tuned! :)
- Ilya
 
wow this is really interesting... can't wait to see where this all goes.
I've just been getting trading signals here... t.me/coinbeacon

Cheers!
 
Thanks for all your contributions! What's the app called? Tried searching but didn't find it.
 
Awesome! I read your tl;dr (I know pretty much nothing about finance or day-trading but wouldn't mind jumping in) about buying at midnight/10 am and selling at 11pm. Is this enough to know for now? I'll download the app when I get home (I have Android).

Edit: I went on the website but the charts don't generate on mobile (maybe I'm using it wrong) but I guess that's what apps are for. Looking forward to the updates.
 
Last edited:
Awesome! I read your tl;dr (I know pretty much nothing about finance or day-trading but wouldn't mind jumping in) about buying at midnight/10 am and selling at 11pm. Is this enough to know for now? I'll download the app when I get home (I have Android).

Edit: I went on the website but the charts don't generate on mobile (maybe I'm using it wrong) but I guess that's what apps are for. Looking forward to the updates.
Hey :)

The basics of day trading is just buying low and selling higher.
It's an art of finding a position when the price is low but is about to go up --> profit = sellPrice - buyPrice ( - trading fees)

The charts on our website should only be used on a desktop machine (/laptop), they are not designed for mobile devices.
The app we have only shows our AI generated predictions, nothing more and nothing less.
Even though the predictions can be useful, it's not a magical tool. Use the app carefully, and definitely stay tuned for our next app which will have more meaningful features.

Cheers!
Ilya

PS: don't buy into the "buy at midnight, sell at 8pm" story. If you read those posts carefully, you'll see me mentioning several times that it's a very biased analysis. These analyses show what the best times were in the past 1/2/3 months, they do not promise the future to be alike.
 
I went on the web version on my laptop (Xubuntu Linux, Firefox), chose the 2D predictions option and generated with the default settings and the three prediction colors are the same line. I changed the settings but they're the same line. Are they supposed to be? I skimmed the two Medium articles linked on the bottom of the page but didn't find anything addressing it (may have missed it). Sorry if I'm annoying you with all these quesitons.
 
I went on the web version on my laptop (Xubuntu Linux, Firefox), chose the 2D predictions option and generated with the default settings and the three prediction colors are the same line. I changed the settings but they're the same line. Are they supposed to be? I skimmed the two Medium articles linked on the bottom of the page but didn't find anything addressing it (may have missed it). Sorry if I'm annoying you with all these quesitons.
I see what you mean.
This is indeed a strange anomaly, I've never seen it behave like that before.
I checked for any errors in our system but there were none, so it appears it be working just fine.
Right now the prediction lines are flat (horizontally), if it stays like this in the next few hours then I'll investigate further.
 
Profitable Crypto trading strategies part 4: revision of Prometheus and Pistis

You may recall our previous trading strategy called Prometheus, which yielded ROIs of +50% per month. In this post I am going to explain why Prometheus is flawed and present some adjustments.

1*pBQDfD8tSTnDSIVyE2LxZw.png

Snippet from Prometheus 2.0 algorithm on LTC-USDT market.
The chart above displays how Prometheus (2.0) makes its Buy and Sell decisions in the LTC-USDT market. Almost every single trade is a successful one, i.e. a nice profit is made.

Back testing is flawed
There is however a big problem with back testing systems which makes them flawed. As in our case when Prometheus generates over 50% ROI over 30 days, it does so on static historical data. Back testing algorithms are designed and used to analyze the performance of some trading algorithm, but deploying them into the real world (i.e. into a trading bot) will not necessarily make them perform the same way.

I finally understand why trading bot developers are stunned when their bot no longer works, but does really well in a simulated (back testing) environment. I already was suspicious of this happening when working on Prometheus, because I noticed that the ROIs were negative when backtesting with price values selected at random from the [Low, High] range; while the prices from [Open, Close] range yielded these great ROIs.

The reason is that a real trading environment is changing continuously. Many of these automated trading systems are developed using a WebSocket API from some exchange, and these WebSockets broadcast prices every second or so. This also means that every second our algorithm is triggered and has to make a decision to either buy, sell or hold. If the algorithm(s) and system is not engineered carefully, it will quickly drain your assets. Another challenge is bookkeeping — in such a fast environment one needs make sure all required data is properly stored and easily accessible since every second counts. Lastly, I conclude that a strategy will work well in real-time systems if it yields positive ROIs when back tested within the [Low, High] range. In other words, making an algo work through back testing in the [Low, High] range ensures it will work just as well in real-time trading.

The problem with Prometheus was that its algorithm worked tremendously well on static data, but it was not designed to handle a continuous flow of data, so it ended up generating hundreds of different signals within the interval of a single candlestick (i.e. hundreds in a single hour). The unfortunate part is that Prometheus’ algo has become useless despite it being very simple and its ROI very promising. For now I put Prometheus on the side until figure out how to make it work in a real-trading system.

Pistis to the rescue
In preparation for our upcoming app, we are constantly working on developing new trading strategies. These will then be used to generate trading signals. In part three of our series I’ve introduced the “Pistis” algorithm, and even though it has a lower ROI compared to Prometheus, it actually does work well in a real-trading environment.

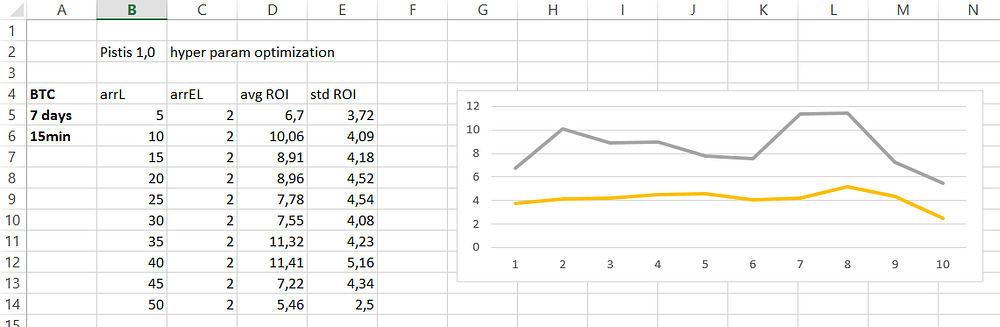
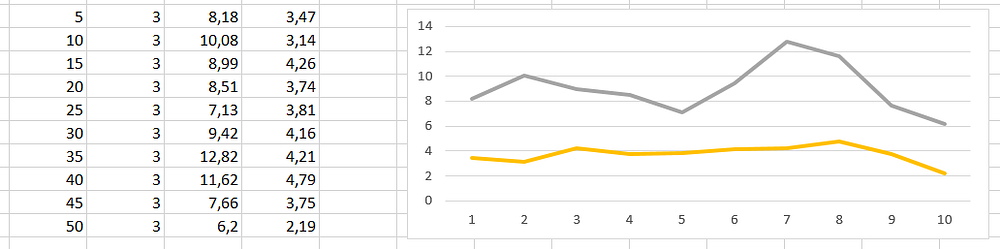
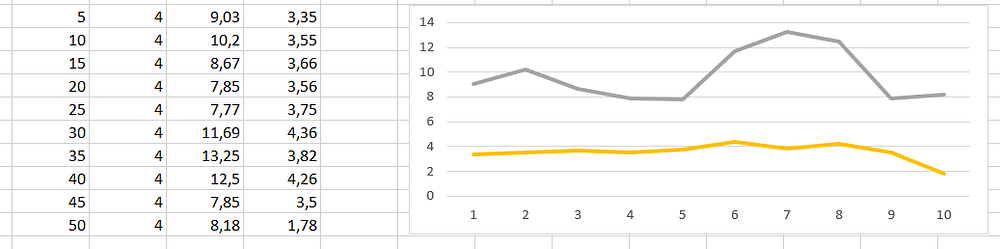
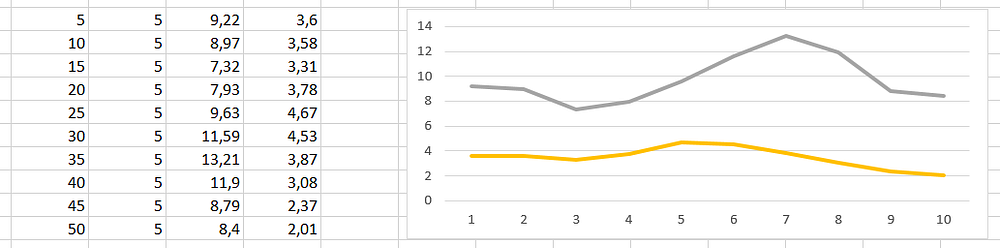
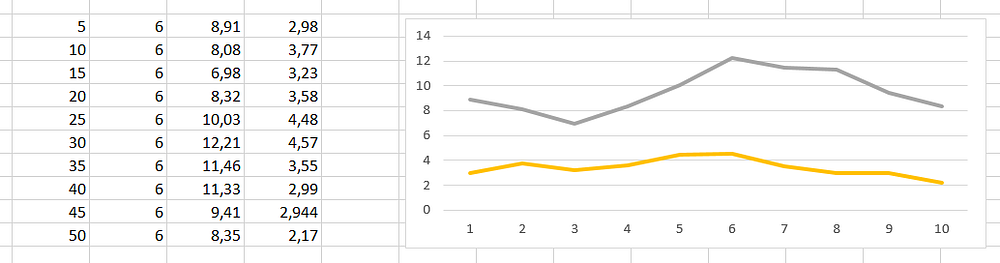
It does however have two hyper-parameters which need to be optimized. So earlier today I’ve spent some looking for some optimal combinations. The screenshots below show the outcomes for different parameter values measured with ROI and its respected standard deviation (in %). These ROIs are computed over 7-day period for BTC-UDT at 15 minute intervals.

1*C8FO9XRbGEm-fctwYmSKVA.png

Pistis param arrEL = 2
1*tCg-12Bp_gfzzeSuPvAOwg.png

Pistis param arrEL = 3
1*fe_jZZIWVlO2TmV5Qj34tQ.png

Pistis param arrEL = 4
1*yy4wkonfjkZnfGWRs8x3Cw.png

Pistis param arrEL = 5
1*DHAv6up89EDSRWLcyJbeUg.png

Pistis param arrEL = 6
The initial algorithm had randomly chosen parameters (arrL = 20 and arrEL = 3) which are actually sub-optimal compared to what we have here. The next step was then to replicate Pistis (version 1.1) and use parameters arrL=35 and arrEL=4 , because it is at these values that the peaks are formed (i.e. highest ROIs).

Apart from finding and optimizing hyper-parameters, we also have to adjust the decisions made by these algorithms. And once again, this becomes a long and tedious process for tweaking and optimizing the small details just to get a slightly higher ROI.

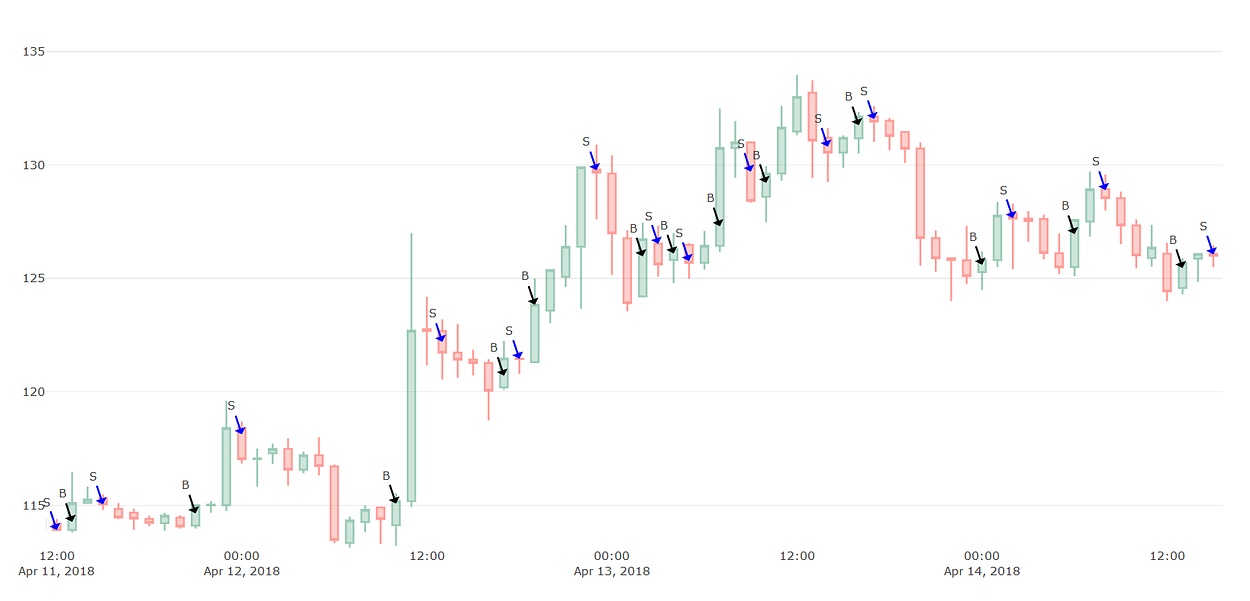
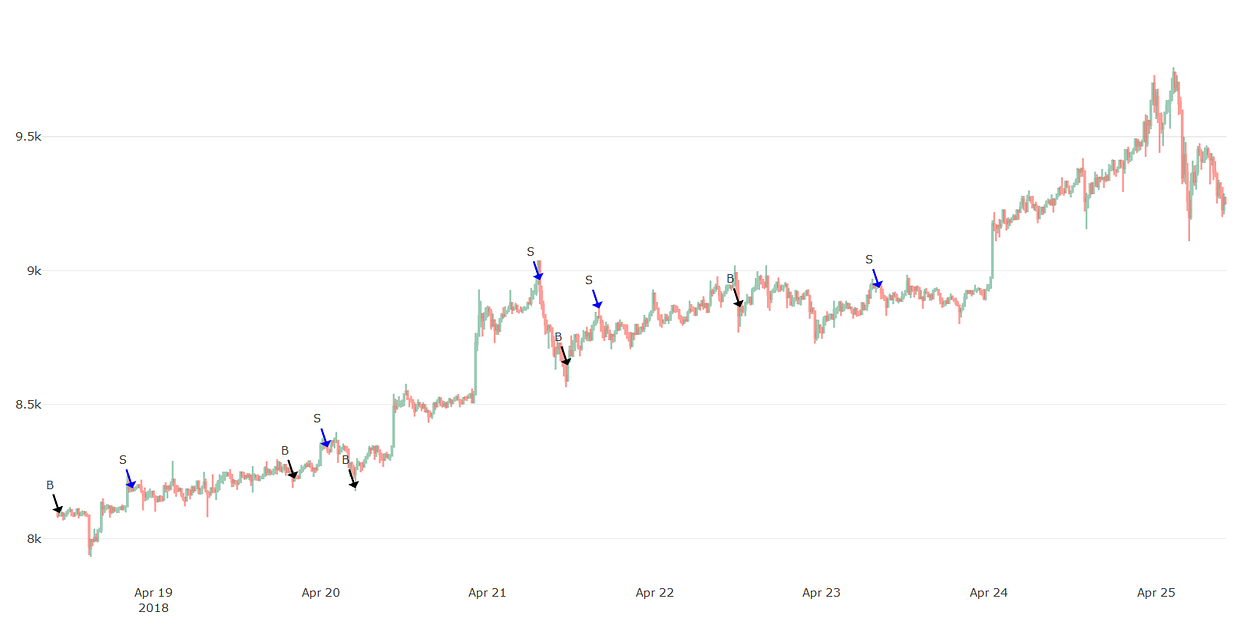
The chart below shows the Buy and Sell decisions from the Pistis algorithm. What’s apparent is that there are pretty long delays between each signal, it takes several hours or days before it decides to buy or sell.

1*nvbYGtmQVK2f1y_sdsFlnw.png

Pistis with hyper-parameters arrL=35, arrEL=4
Pistis in its current from should be considered a medium to long-term trading strategy. On sight this algo seems to work pretty well in an up-trend market, but whether it will be profitable during long down-trend periods yet needs to be analyzed.

I can say however that Pistis only works well for BTC, not so for ETH or LTC. But I’m pretty confident that with some modifications we can overcome these limitations.

Thank you for reading and stay tuned for more! :)
- Ilya
 
Really interesting.There are a lot of "AI" prediction software/ ICO's you name it. Wondering what makes this different and better (accurate) then the rest out there? Either way I will be following!
 
Back
Top