
You are using an out of date browser. It may not display this or other websites correctly.
You should upgrade or use an alternative browser.
You should upgrade or use an alternative browser.
[Journey] - trading bot that may actually work
- Thread starter francisirving
- Start date

Grelmoss
Registered Member
- Jun 14, 2019
- 62
- 37
That's overfitted for sure.
There are mad scientists trying to make profitable models in the financial markets... (and going nowhere)
So believe me, it's really hard and you will go nowhere with technical analysis, it's numerology
Not trying to take you down, but that's the reality of the market. The whole point of algotrading is spotting inefficiences in the market, not an easy task for sure.
There are mad scientists trying to make profitable models in the financial markets... (and going nowhere)
So believe me, it's really hard and you will go nowhere with technical analysis, it's numerology
Not trying to take you down, but that's the reality of the market. The whole point of algotrading is spotting inefficiences in the market, not an easy task for sure.
francisirving
Registered Member
- Dec 22, 2013
- 64
- 46
Building off my last post, my intentions for this week were:
- continue trading off the 1 hour timeframe
- double the lot sizes (0.02 for NASDAQ/XAUUSD, 0.04 for forex)
- purge forex pairs to just USDJPY
- look into setting possible stop losses as needed
so Sunday evening into Monday afternoon (I'm US east coast time) it did ok

Going through the charts I just knew I was leaving a lot on the table, so I started backtesting the 15 and 5 minute timeframes. I'll give you an example.
This is the last two 1-hour timeframe indicator alerts for XAUUSD

Trading the bot normally, from start of indicator to start of next indicator, would have been about a 3 pip loss for the 'sell' position on the left, but about a 17 pip win (so far) for the 'buy' indicator next to it. Remember a trade will open/close when it see's the next indicator appear (assuming no stop loss). But you can see how far down that 'sell' position went were it would have made profit before swinging back up to close the position at a loss.
Looking at the same chart area on the 15 minute timeframe shows a different story. (theres a decent loss before the 'nice profit' I overlooked)

So now I'm looking for the 'goldilocks' timeframe. For Monday evening going into Tuesday afternoon I decided to try the 15 minute timeframe
have to pause, will continue soon
- continue trading off the 1 hour timeframe
- double the lot sizes (0.02 for NASDAQ/XAUUSD, 0.04 for forex)
- purge forex pairs to just USDJPY
- look into setting possible stop losses as needed
so Sunday evening into Monday afternoon (I'm US east coast time) it did ok
Going through the charts I just knew I was leaving a lot on the table, so I started backtesting the 15 and 5 minute timeframes. I'll give you an example.
This is the last two 1-hour timeframe indicator alerts for XAUUSD
Trading the bot normally, from start of indicator to start of next indicator, would have been about a 3 pip loss for the 'sell' position on the left, but about a 17 pip win (so far) for the 'buy' indicator next to it. Remember a trade will open/close when it see's the next indicator appear (assuming no stop loss). But you can see how far down that 'sell' position went were it would have made profit before swinging back up to close the position at a loss.
Looking at the same chart area on the 15 minute timeframe shows a different story. (theres a decent loss before the 'nice profit' I overlooked)
So now I'm looking for the 'goldilocks' timeframe. For Monday evening going into Tuesday afternoon I decided to try the 15 minute timeframe
have to pause, will continue soon
francisirving
Registered Member
- Dec 22, 2013
- 64
- 46
A really nice Monday evening into Tuesday afternoon. We had a 'Super Tuesday' event (as I like to call it, things seem to happen on Tuesdays) with the government announcing lower than expected inflation numbers, causing some things to rip up (NASDAQ) and some to rip down (USDJPY)
I decided on a 5 minute timeframe to test
- 5 minute timeframe
- I think 100pip SL for XAUUSD at that time, its a blur
- NASDAQ, XAUUSD, USDJPY
all times in the screenshots below are UTC+2

At this point I'm still missing trades for some reason, but, a nice day overall
Tuesday into Wednesday was really nice. I figured out that I left the chart timer on 15 minutes instead of 5 (duh). Corrected that and I started to miss a lot fewer trades. I also set a stop loss for NASDAQ and USDJPY based on the metrics I could find.
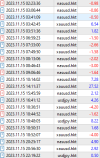
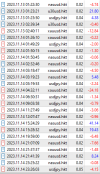
And today just crushed it. I found a 50 second sleep timer I set to pause the program after it places a trade. I think I had that there when I was on the 1-hour chart. It's fine for 1 hour, but on the 5-minute chart it was resulting in missed trades. Set it to 2 seconds for now.
(added the stop loss hits to the end of the screenshot so you can see the SL vs normal close trigger losses, SL outlined in red)
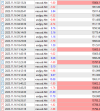
The bot is done for the day. To be honest if I was live account trading I'd be done for the week, but, this is just a test account so it will restart at 6:00pm EST tonight
Grand total at this time. Started with $200 on the evening of Nov. 5

+60.67%
Takeaways
- Even if this was an abnormal week there's little doubt in my mind at this point that this strategy will work. I'll just keep the bot running with its current parameters and see how it does day-over-day for now
- assuming its going to go well, my big issue in the future is going to be horizontal scale of redundancy and resiliency. Running a server out of my house is fine for 1 account, but as the months roll on and the account grows the plan would be to split the accounts into several smaller accounts with different exchanges and 'servers' (physical or cloud, etc) in different physical locations. This way if an account is hacked, or there's a power outage, or an exchange decides its going to keep my money, I'd have this spread out over several platforms and locations
I'll try to do an end of week update tomorrow to see how it went.
I decided on a 5 minute timeframe to test
- 5 minute timeframe
- I think 100pip SL for XAUUSD at that time, its a blur
- NASDAQ, XAUUSD, USDJPY
all times in the screenshots below are UTC+2
At this point I'm still missing trades for some reason, but, a nice day overall
Tuesday into Wednesday was really nice. I figured out that I left the chart timer on 15 minutes instead of 5 (duh). Corrected that and I started to miss a lot fewer trades. I also set a stop loss for NASDAQ and USDJPY based on the metrics I could find.
And today just crushed it. I found a 50 second sleep timer I set to pause the program after it places a trade. I think I had that there when I was on the 1-hour chart. It's fine for 1 hour, but on the 5-minute chart it was resulting in missed trades. Set it to 2 seconds for now.
(added the stop loss hits to the end of the screenshot so you can see the SL vs normal close trigger losses, SL outlined in red)
The bot is done for the day. To be honest if I was live account trading I'd be done for the week, but, this is just a test account so it will restart at 6:00pm EST tonight
Grand total at this time. Started with $200 on the evening of Nov. 5
+60.67%
Takeaways
- Even if this was an abnormal week there's little doubt in my mind at this point that this strategy will work. I'll just keep the bot running with its current parameters and see how it does day-over-day for now
- assuming its going to go well, my big issue in the future is going to be horizontal scale of redundancy and resiliency. Running a server out of my house is fine for 1 account, but as the months roll on and the account grows the plan would be to split the accounts into several smaller accounts with different exchanges and 'servers' (physical or cloud, etc) in different physical locations. This way if an account is hacked, or there's a power outage, or an exchange decides its going to keep my money, I'd have this spread out over several platforms and locations
I'll try to do an end of week update tomorrow to see how it went.
Attachments



francisirving
Registered Member
- Dec 22, 2013
- 64
- 46
Grelmoss sums up my feelings on technical analysis, but, if you are good at it and make money with it keep on going, that's awesome.You must also consider fundamental analysis also, rather than technical analysis.
My bot is built entirely around risk management, that's it. The indicator I use to open/close trades is not even that relevant. I have no idea from one minute to the next what the price of an asset is going to do, so, all I can do is manage my risk per trade. I back test historical data of my indicator to get an idea of a hard stop loss to set and when I have a runner, it (hopefully) will make more money than it loses over time. You can see from my most recent screenshots that that is what I'm shooting for. Time will tell how it goes.
francisirving
Registered Member
- Dec 22, 2013
- 64
- 46
stopping with a small loss today:

I'm not surprised, since I figured today would be a light day after the heavy trading this week. It's why I said in my last post that if this was a live account I'd be done trading for the week.
But looking at the trades further its been NASDAQ that's been holding me down all today, and underperforming all week. For instance, if I hadn't traded NASDAQ today it would have been a nice little 'up' day:
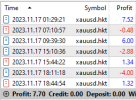

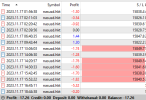
I'll dig into the NASDAQ details this weekend to see if anything can be tweaked. I'm not ready to drop it because historically it's been a good performer, but, we will see. Interestingly enough it was USDJPY that was the big winner this week. I'm also going to look at the charts to see if there is another forex pair or two I'd like to add to the rotation for testing.
I expect it to be light next week due to the US holiday, so another test week awaits. This week was fantastic though.
+44.89% for the week
+58.88% since the Nov 5 start
I'm not surprised, since I figured today would be a light day after the heavy trading this week. It's why I said in my last post that if this was a live account I'd be done trading for the week.
But looking at the trades further its been NASDAQ that's been holding me down all today, and underperforming all week. For instance, if I hadn't traded NASDAQ today it would have been a nice little 'up' day:
I'll dig into the NASDAQ details this weekend to see if anything can be tweaked. I'm not ready to drop it because historically it's been a good performer, but, we will see. Interestingly enough it was USDJPY that was the big winner this week. I'm also going to look at the charts to see if there is another forex pair or two I'd like to add to the rotation for testing.
I expect it to be light next week due to the US holiday, so another test week awaits. This week was fantastic though.
+44.89% for the week
+58.88% since the Nov 5 start
francisirving
Registered Member
- Dec 22, 2013
- 64
- 46
Sunday into Monday decided to add AUDJPY, CADJPY and NZDJPY to the rotation using USDJPY stop-loss as a template. Some gains but NZDJPY was a massive drag on the earnings.
Monday I wanted to mess around with the 1-minute timeframe again during the day, but still didn't like it. Lost like $70 on the demo account so just went back to the 5-minute for the Monday overnight into Tuesday morning.
Before I went to bed last night I noticed I was up 18% in a few hours, but was back to the beginning in the morning, mostly due to NZDJPY, AUDJPY, and a missed trade on XAUUSD. NZDJPY was bad, it's very spikey which would blow the stop loss more than not before continuing on its path. AUDJPY was just not working out either so dropped them both. Still, I was impressed with the break even.
I stopped the bot this morning around 9am, took out NZDJPY and AUDJPY then started the bot around 11am.
XAUUSD - 1.2pip stop loss (or 120 based on your scale) 0.02 lots
NASUSD - 80pip stop loss 0.02 lots
USDJPY - 140pip stop loss 0.05 lots
CADJPY - 100pip stop loss 0.05 lots
worked out good, bot ran from 11am to 2:15pm when I shut it down. Made about 14.4%
excellent for 3 hours
It's looking like the way this is going to go when I push this into a live account in a couple of weeks is that I'll be taking profits as I see fit. Stopping the bot somewhere between just after 8:30 am (sometimes the first big push of the day) to just before 9:30am (start of trade day), then restarting around 10-10:30am once it stabilizes a bit.
My goal is to consistently average 20-25% (per week) of the account value at the beginning of the week, week over week, month over month. I think it will be very doable, but we will see. All earnings will be compounded, and lot sizes scaled up accordingly.
Using XAUUSD as a base, I'm using 0.02 lots for $200. I'll scale that to 0.03 lots when the account hits $300(again lol), 0.04 for $400, etc.
Monday I wanted to mess around with the 1-minute timeframe again during the day, but still didn't like it. Lost like $70 on the demo account so just went back to the 5-minute for the Monday overnight into Tuesday morning.
Before I went to bed last night I noticed I was up 18% in a few hours, but was back to the beginning in the morning, mostly due to NZDJPY, AUDJPY, and a missed trade on XAUUSD. NZDJPY was bad, it's very spikey which would blow the stop loss more than not before continuing on its path. AUDJPY was just not working out either so dropped them both. Still, I was impressed with the break even.
I stopped the bot this morning around 9am, took out NZDJPY and AUDJPY then started the bot around 11am.
XAUUSD - 1.2pip stop loss (or 120 based on your scale) 0.02 lots
NASUSD - 80pip stop loss 0.02 lots
USDJPY - 140pip stop loss 0.05 lots
CADJPY - 100pip stop loss 0.05 lots
worked out good, bot ran from 11am to 2:15pm when I shut it down. Made about 14.4%
excellent for 3 hours
It's looking like the way this is going to go when I push this into a live account in a couple of weeks is that I'll be taking profits as I see fit. Stopping the bot somewhere between just after 8:30 am (sometimes the first big push of the day) to just before 9:30am (start of trade day), then restarting around 10-10:30am once it stabilizes a bit.
My goal is to consistently average 20-25% (per week) of the account value at the beginning of the week, week over week, month over month. I think it will be very doable, but we will see. All earnings will be compounded, and lot sizes scaled up accordingly.
Using XAUUSD as a base, I'm using 0.02 lots for $200. I'll scale that to 0.03 lots when the account hits $300(again lol), 0.04 for $400, etc.
vincentontop
Junior Member
- Aug 8, 2017
- 121
- 27
Good thread
francisirving
Registered Member
- Dec 22, 2013
- 64
- 46
Tuesday evening into Wednesday AM (stopped the bot and closed all positions just before the 9:30am opening bell)
Then manually bot back into all positions around 10:05 and restarted the bot
to test a theory on taking profits, stopped the bot and manually closed all positions at 10:17
the results below are pretty much from 6pm Tuesday to 10:17am Wednesday minus the takeprofits and stops I stated above
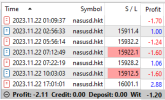


+29.66 total for a change of +12% from last nights start.
As I said in my last post, my goal is going to be to increase the weekly start value of the account by 20-25% per week. If this were a live account, and I stuck to that idea, I'd be done for the week at this point. Since this is a demo account I'll start the bot back up after posting this and keep testing.
Looking at the results, gold (XAUUSD) is getting clobbered this week, which sucks since it did pretty well the last two weeks.
Early this morning the bot missed 2 trades, shown in green

That buy would have been about a 11pip win. Looking at the buy/sells of XAUUSD there was also a sell that popped in the middle of that run but then disappeared. Unfortunately this isnt uncommon with the indicators as they will occasionally appear or disappear based on what it sees. It was more than likely that the 'buy' indicator in the image appeared too late to be scanned, and the missing 'sell' indicators would have stopped the trade anyways (but at a profit). All I could do would be to expand the 'x' axis that is being scanned to catch later indicator appearances.
NASUSD was not as ugly, but disappointing.

The 2 trades in the green circle were missed. Again, that buy would have been a nice profit. My guess is the same, the 'buy' signal appeared and stayed solid too long after the 'x' axis would scan it. I think I'm going to widen the 'x' axis scan area tonight a little and see what happens. Since the 'x' axis is scanned right to left (newest data to oldest data) it should be fine.
USDJPY and CADJPY crushed it. I have no idea how that will continue to play out as I go, we will see. I'd still like to find another pair to put into the rotation for testing. I'll do some backtesting today.
Then manually bot back into all positions around 10:05 and restarted the bot
to test a theory on taking profits, stopped the bot and manually closed all positions at 10:17
the results below are pretty much from 6pm Tuesday to 10:17am Wednesday minus the takeprofits and stops I stated above
+29.66 total for a change of +12% from last nights start.
As I said in my last post, my goal is going to be to increase the weekly start value of the account by 20-25% per week. If this were a live account, and I stuck to that idea, I'd be done for the week at this point. Since this is a demo account I'll start the bot back up after posting this and keep testing.
Looking at the results, gold (XAUUSD) is getting clobbered this week, which sucks since it did pretty well the last two weeks.
Early this morning the bot missed 2 trades, shown in green
That buy would have been about a 11pip win. Looking at the buy/sells of XAUUSD there was also a sell that popped in the middle of that run but then disappeared. Unfortunately this isnt uncommon with the indicators as they will occasionally appear or disappear based on what it sees. It was more than likely that the 'buy' indicator in the image appeared too late to be scanned, and the missing 'sell' indicators would have stopped the trade anyways (but at a profit). All I could do would be to expand the 'x' axis that is being scanned to catch later indicator appearances.
NASUSD was not as ugly, but disappointing.
The 2 trades in the green circle were missed. Again, that buy would have been a nice profit. My guess is the same, the 'buy' signal appeared and stayed solid too long after the 'x' axis would scan it. I think I'm going to widen the 'x' axis scan area tonight a little and see what happens. Since the 'x' axis is scanned right to left (newest data to oldest data) it should be fine.
USDJPY and CADJPY crushed it. I have no idea how that will continue to play out as I go, we will see. I'd still like to find another pair to put into the rotation for testing. I'll do some backtesting today.
francisirving
Registered Member
- Dec 22, 2013
- 64
- 46
I paused the bot for a moment to show you how ridiculous and chaotic trading is, and how things can drastically change in a short period of time.
I've been doing a lot of changes and testing the last week. Changing/Testing = losses, just so you know, so I've been at a break even for the last week. Actually, last night was not good as I was missing trades and taking more losses then wins. Started with roughly $300, would go up, but was sitting at around $255ish at one point. Fixed some issues and restarted the bot around 10am EST with manual placed trades in the current trend direction. A couple hours later, boom, we are in a Super Tuesday event again. It's like being in a hurricane on a sailboat.
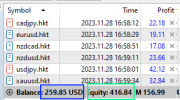
The account shot up 60% in a couple hours because the market went crazy for (check notes; market hopes fed is done raising rates? Amazon has a new AI chip? good Black Friday results? It's Tuesday again?), I don't know. It had nothing to do with me and these positions were open manually because I made some changes and just bought them back in based on the current position of the indicator.
Blind luck.
But, I'm noticing a lot of 'blind luck' on Tuesdays, sometimes Wednesdays, it doesn't matter. What matters is that my bot will be available and ready for when it happens, and I'll use good risk management for when things don't go my way.
So, at this snapshot in time, the account is up 108% since Nov. 6, with lots of problems, testing, changes, and modifications along the way. It can be done, and I think this is the last week of big changes as I settle on some parameters:
- back to using 'VMC Cipher _A B&S Signals' indicator over 'SWING TRADE SIGNALS' indicator. VMC is just way more accurate. The problem I've had with it historically was that it is a 'slow' signal (which is probably why its more accurate), so pyautogui wasnt picking it up as the indicator was appearing past the screenshot area. I've corrected this by simply extending the 'x' axis 25% (from like 15 to 20 pixels) and now its barely missing trades.
- 3 minute timeframe. I've been using 5 minute for a week or so but with the improvements catching the VMC signals, 3 minutes has become viable. I don't want to mess with 1 minute timeframes again as they are just too erratic for me. Even 3 minutes can be hairy but VMC does a good job with it.
- trading pairs will likely come and go depending on how they are performing at a given time. I'm ok with that. Currently testing XAUUSD, USDJPY, CADJPY, EURUSD, NZDCAD and NZDUSD, NASDAQ is out for now.
Back to testing. Next week I'm testing a small, live account.
I've been doing a lot of changes and testing the last week. Changing/Testing = losses, just so you know, so I've been at a break even for the last week. Actually, last night was not good as I was missing trades and taking more losses then wins. Started with roughly $300, would go up, but was sitting at around $255ish at one point. Fixed some issues and restarted the bot around 10am EST with manual placed trades in the current trend direction. A couple hours later, boom, we are in a Super Tuesday event again. It's like being in a hurricane on a sailboat.
The account shot up 60% in a couple hours because the market went crazy for (check notes; market hopes fed is done raising rates? Amazon has a new AI chip? good Black Friday results? It's Tuesday again?), I don't know. It had nothing to do with me and these positions were open manually because I made some changes and just bought them back in based on the current position of the indicator.
Blind luck.
But, I'm noticing a lot of 'blind luck' on Tuesdays, sometimes Wednesdays, it doesn't matter. What matters is that my bot will be available and ready for when it happens, and I'll use good risk management for when things don't go my way.
So, at this snapshot in time, the account is up 108% since Nov. 6, with lots of problems, testing, changes, and modifications along the way. It can be done, and I think this is the last week of big changes as I settle on some parameters:
- back to using 'VMC Cipher _A B&S Signals' indicator over 'SWING TRADE SIGNALS' indicator. VMC is just way more accurate. The problem I've had with it historically was that it is a 'slow' signal (which is probably why its more accurate), so pyautogui wasnt picking it up as the indicator was appearing past the screenshot area. I've corrected this by simply extending the 'x' axis 25% (from like 15 to 20 pixels) and now its barely missing trades.
- 3 minute timeframe. I've been using 5 minute for a week or so but with the improvements catching the VMC signals, 3 minutes has become viable. I don't want to mess with 1 minute timeframes again as they are just too erratic for me. Even 3 minutes can be hairy but VMC does a good job with it.
- trading pairs will likely come and go depending on how they are performing at a given time. I'm ok with that. Currently testing XAUUSD, USDJPY, CADJPY, EURUSD, NZDCAD and NZDUSD, NASDAQ is out for now.
Back to testing. Next week I'm testing a small, live account.

meenakshiavvi
Registered Member
- May 9, 2021
- 54
- 24
I have developed a custom strategy and still working on it.


moonrivered
Registered Member
- Jun 13, 2023
- 51
- 14
any update on this?
francisirving
Registered Member
- Dec 22, 2013
- 64
- 46
My bot got killed a couple months back when Hankotrade lost access to MT5 and went with their own ACT Trader setup. For the last couple of months, I've been manually trading and trying to figure out a way to get the ACT Trade REST API to work with my bot, but hell if I can do it. The documentation is poor, and it sure seems a lot of the URLs they call to are gone or missing.
So, last weekend I opened a demo account with a trader that can still use MT5 to get things moving again. I'm working with a new indicator ( SATY Pivot Ribbon) and the most complex trading rules my feeble scripting skills can make work.
I'm on day 4, squashing bugs and logic issues as I go. It's been promising so far, the accounts up 11.5% as of this writing and that's with it missing lots of trades or just flat out breaking due to improper exception issues (I might have that fixed).
I bet I still have another week of development and break-fix before I start tracking win/losses/profit/loss but pretty excited with it so far.
So, last weekend I opened a demo account with a trader that can still use MT5 to get things moving again. I'm working with a new indicator ( SATY Pivot Ribbon) and the most complex trading rules my feeble scripting skills can make work.
I'm on day 4, squashing bugs and logic issues as I go. It's been promising so far, the accounts up 11.5% as of this writing and that's with it missing lots of trades or just flat out breaking due to improper exception issues (I might have that fixed).
I bet I still have another week of development and break-fix before I start tracking win/losses/profit/loss but pretty excited with it so far.
francisirving
Registered Member
- Dec 22, 2013
- 64
- 46
I'm going to document the revised trading strategy. This is not set it stone as the bot is still under development and testing, but the basic flow is there
account: $1000 demo account
pair: NAS100
lot size: 1 (smallest I can go on this exchange for the NAS100, but thats fine)
Stop Loss: 7 pips (about 1% of the account size)
Indicator: 'Saty Pivot Ribbon' - default settings, disable slow conviction (not needed), just color changes for pyautogui purposes
There's a few videos out there going over this indicator, most of which talk about a 'vomiting dolphin' technique or something, I never quite got it. But I like the indicator because it just made sense to me. Here's a sample:

The strategy is pretty easy, but more complicated then my old ones of 'open a trade at the buy indicator and close it at the sell indicator' (which worked great sometimes and sometimes sucked, depended on the day and pair)
*assuming no open positions and a 'Buy' signal is seen. Reverse for 'Sell' signals
- When the buy signal appears, wait 60 seconds (I want to check the next candle) and go to a 'buy confirm' function below
- start a loop that goes 7 times max (I want to check the next 6-8 minutes worth of candles for my 'buy' condition)
- if the bottom of the candle (including the wick) is at least 1.6pips HIGHER then the fast conviction EMA, open a 'buy' order
(thats the confluence, I was originally also looking for the candle color to match the direction (green for a long) but on the 1 minute chart it doesnt matter much and I am missing a lot of trades)
- if the bottom of the candle/wick is closer then 1.6pips, no trade. wait 60 seconds then try again, for a max of 7 times
Heres a screenshot with an ugly purple line to show you the bottom of the candle compared to the fast conviction EMA

Once a long position is open a 'close position' function will loop until a close condition is met. they are:
- the stop loss is hit
- the fast conviction EMA crosses below the pivot EMA
- a 'Sell' indicator is seen on the screen
assuming it doesnt get stopped out it it will most always close when the EMA's cross, because thats the condition that causes the 'buy/sell' conditions to appear.
Obviously, the detailes are inverse for 'sell' conditions.
That's it, I'm just trying to minimize false-positives with the confluence, minimize losses and wait for the big pulls up or down to make money. As a rough idea here's some of the latest trades and totals on the demo account since Sunday night. Keep in mind I've missed a lot of good trades due to crashes and bad logic. Hopefully it keeps getting better and better as I fix breaking issues and fine tune the logic.
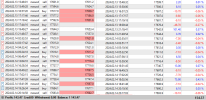
The big pumpers were stopped manually when I'd see fit (like if it was moving sideways), which I'd highly suggest to anyone trading because the NAS100 is a bi-polar beast that can swing on a dime, especially on the 1-minute timeframe. You still have to use your experience and intuition.
account: $1000 demo account
pair: NAS100
lot size: 1 (smallest I can go on this exchange for the NAS100, but thats fine)
Stop Loss: 7 pips (about 1% of the account size)
Indicator: 'Saty Pivot Ribbon' - default settings, disable slow conviction (not needed), just color changes for pyautogui purposes
There's a few videos out there going over this indicator, most of which talk about a 'vomiting dolphin' technique or something, I never quite got it. But I like the indicator because it just made sense to me. Here's a sample:
The strategy is pretty easy, but more complicated then my old ones of 'open a trade at the buy indicator and close it at the sell indicator' (which worked great sometimes and sometimes sucked, depended on the day and pair)
*assuming no open positions and a 'Buy' signal is seen. Reverse for 'Sell' signals
- When the buy signal appears, wait 60 seconds (I want to check the next candle) and go to a 'buy confirm' function below
- start a loop that goes 7 times max (I want to check the next 6-8 minutes worth of candles for my 'buy' condition)
- if the bottom of the candle (including the wick) is at least 1.6pips HIGHER then the fast conviction EMA, open a 'buy' order
(thats the confluence, I was originally also looking for the candle color to match the direction (green for a long) but on the 1 minute chart it doesnt matter much and I am missing a lot of trades)
- if the bottom of the candle/wick is closer then 1.6pips, no trade. wait 60 seconds then try again, for a max of 7 times
Heres a screenshot with an ugly purple line to show you the bottom of the candle compared to the fast conviction EMA
Once a long position is open a 'close position' function will loop until a close condition is met. they are:
- the stop loss is hit
- the fast conviction EMA crosses below the pivot EMA
- a 'Sell' indicator is seen on the screen
assuming it doesnt get stopped out it it will most always close when the EMA's cross, because thats the condition that causes the 'buy/sell' conditions to appear.
Obviously, the detailes are inverse for 'sell' conditions.
That's it, I'm just trying to minimize false-positives with the confluence, minimize losses and wait for the big pulls up or down to make money. As a rough idea here's some of the latest trades and totals on the demo account since Sunday night. Keep in mind I've missed a lot of good trades due to crashes and bad logic. Hopefully it keeps getting better and better as I fix breaking issues and fine tune the logic.
The big pumpers were stopped manually when I'd see fit (like if it was moving sideways), which I'd highly suggest to anyone trading because the NAS100 is a bi-polar beast that can swing on a dime, especially on the 1-minute timeframe. You still have to use your experience and intuition.


francisirving
Registered Member
- Dec 22, 2013
- 64
- 46
To answer both those last questions, I cant imagine I'd ever sell it for 2 reasons:Fun nerd shit bro , love it and welcome back.
Have you considered building and selling your set up to others and reinvesting the sales into your trading?
Might be a nice way to parlay some cash .
1 - the bot is pixel based and can be a trick to maintain
2 - I'm a firm believer in 'if its works why are you selling it?' I'd give the source code away for free if I think it's worth it. It's not doing anything special that a real Python coder couldnt make better. It's about the strategy+risk management, not the bot.

BlueBlinker
Junior Member
- Nov 5, 2023
- 104
- 147
hmmm welp it is interesting