
You are using an out of date browser. It may not display this or other websites correctly.
You should upgrade or use an alternative browser.
You should upgrade or use an alternative browser.
Cryptocurrency analysis and predictions using AI and big data
- Thread starter healzer
- Start date


healzer
Elite Member
- Jun 26, 2011
- 2,974
- 3,063
Hi guys 
Thank you for your lovely comments!
There is a reason why I haven't been active this past week.
I was fortunate enough to have been invited to NYC by a couple of people who are very interested in this project.
So a week ago I traveled here to meet with them, and we've had a very productive time together.
By the end of this week I will be back home (in Belgium that is) and then I'll post more exciting news and updates.
Stay tuned!
- Ilya

Thank you for your lovely comments!
There is a reason why I haven't been active this past week.
I was fortunate enough to have been invited to NYC by a couple of people who are very interested in this project.
So a week ago I traveled here to meet with them, and we've had a very productive time together.
By the end of this week I will be back home (in Belgium that is) and then I'll post more exciting news and updates.
Stay tuned!
- Ilya
if you knew anything about trading crypto for one thing you wouldnt trying to day trade and you wouldnt be allowing code on your phone . crypto isnt a dat trade ,follow the advice from this app and let me know which one of the two ways you lost everything .
healzer
Elite Member
- Jun 26, 2011
- 2,974
- 3,063
What I learned in New York
Back in December 2017, when I started this entire operation, an old friend and client of mine took high interest in what I was about to do. Since then we’ve been talking a lot and he’s been closely following my progress. About a month ago we agreed to meet each other and transcend our relationship to a new level — he so kindly invited me to visit him in NYC to talk about this business. I never imagined this project alone would take me global. Anyways, about two weeks ago I got on the airplane and since then we had an amazing time together.

He introduced me to some of his dear friends, clients and investors, and most of them were very into this new era of digital currencies and the future blockchain technologies. This was one of the most important lessons I’ve learned, business wise, the blockchain and crypto hype is very real. It’s not just some artificial hype created by influencers and/or big corp, that I am used to read about on social media. People are genuinely investing and building it in tech communities all over the world. Since so many are doing it, it’s hard to imagine for it to just disappear overnight, but it doesn’t mean you should become a full-time investor just yet. Even though the market is highly unregulated, regulations are being put in place — only time can tell what the future will bring, unfortunately I can’t predict that .
Addressing my mistakes
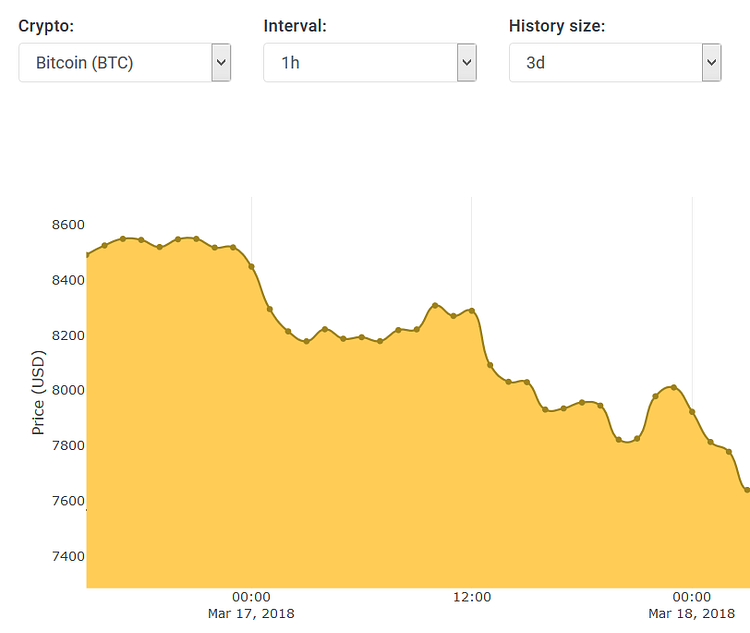
If you’ve been following my progress closely, including the analyses, you will know that the crypto prices I’ve used until now are the average of all mainstream exchanges. Whether you use the app or the desktop website, the prices were always the average of all major exchanges, e.g.:look at the chart with avg. BTC price in orange.
If you are a long term investor, then it doesn’t matter to you if BTC is worth 0.5% more on exchange A than on exchange B. But if you are a day trader then you want to know the exact price on your exchange. Using average prices in my analyses should be considered as a mistake, especially since I am back testing various models and trading strategies on that data. It’s a mistake because we cannot actually buy/sell Bitcoin (or any other coin) using the average price on any exchange at all. The actual buy/sell price will (almost) always differ from the average price. You may wonder why bother about a small variation of merely 0.5%? It does matter a great deal in algorithmic trading, since in the end it is one of my goals to establish a fully (or pseudo) automatic trading system.
A second major issue that I’ve deliberately not incorporated were the trading fees. I have not done this because of the first issue: I was using the average prices, so for simplicity reasons I’ve left them out. Instead I should’ve calculated the average trading fee across all used exchanges or chosen an arbitrary fee such as 0.1% for both buy and sell trades.
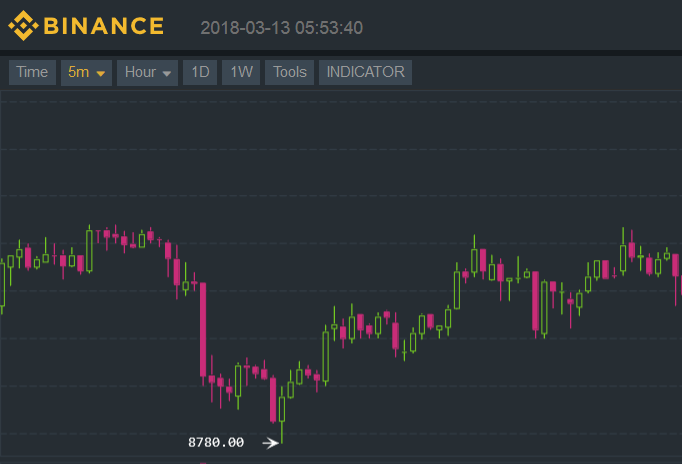
To address these issues, first and foremost I started pulling data from a specific exchange, instead of a third-party API that aggregates crypto data. Since I am a Binance user myself (and not affiliated in any other way), I am going to use Binance in the near future for my analyses and machine learning works. The average prices will remain as is, and will not be replaced by any specific exchange. Instead, in the long run I am going to include all major exchanges such that traders can plug-in to whichever exchange they are using. Each exchange also has a clearly defined fee structure, so for back testing I can include them and produce very accurate results.
After having done the above, I re-ran my previous models and strategies through the back testing system. The ROIs were pretty terrible to say the least. I you look at our previous back testing results, until now the ROIs (without fees and with average prices) were in the range of 5–15%, but are now between 0% and -15% (or worse). Thus in reality our current models and strategies are losing more money than they are making. The reason became apparent pretty quickly, our systems were making a lot of short-term trades. These trades made a small marginal profit, and over a long period (of e.g. 14 days) yield up to 40% returns — however, if we incorporate trading fees for every buy and sell action, these marginal profits become marginal losses.
Short-term profits versus long-term holds
Building an automatic trading bot/tool is child’s play and you can even find many GitHub projects if you don’t want to reinvent the wheel. All they do is connect to your favorite exchange and then buy/sell depending on when you program them to. But the latter is the most difficult part — developing a good model, a good trading strategy is a completely different story.
Major trading institutions invest huge amounts trying to improve theirs. The reality is that no perfect strategy will ever be invented for an unpredictable market. But as we have been doing until now, one can increase its win rates from 50% to 60%, this is the whole purpose of making predictions by means of machine learning. If one can make predictions that are more spot-on than not, then you can make a profit in the long run.
Coming back to our project, the major question is: should we focus on making marginal profits or shift our focus to longer term investments? Eventually it will be a combination of both, but right now I am focusing solely on the short-term strategy.
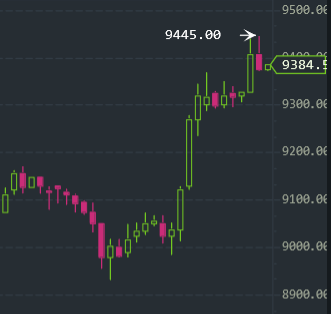
My reasoning is simple: a few months ago I realized that there exist many golden opportunities (almost) every day, within these windows we can make a at least 0.5% (up to 4%) ROI on a single trade. This is indicated on the candlestick chart above. Almost every single day there are short periods where the price rises up very quickly. Afterwards it either stabilizes or drops down again. In this case, if we can detect such an event we can enter a buy trade for $9100/BTC and then sell at $9300/BTC, this would yield us an ROI of 2–3% (depending on the trading fee %). Even by just catching/detecting one such event every day or two would yield a tremendous ROI on a monthly/yearly basis. In the above we bought at $9100/BTC because it takes time to detect such an event, unless one can predict these to some degree then one can buy at an even lower price (e.g. $9000/BTC) thus increasing the ROI.
If you’ve read my previous posts, you may realize this is exactly what our Anomaly Detection (AD) system is designed for. The back testing results from my AD system were terrific (up to 17% ROI in a very short amount of time), but then again, those results were excluding trading fees. Once I included the fees, the results were actually depressing. After careful analysis, the reason is just as explained earlier: too many marginal trades caused the fees to pile up and drive the ROI down. We should still use the AD system but we have to adjust the strategy, we need to carefully determine when to buy and sell. This means the strategy will become riskier, we should minimize the fees while optimizing the ROI — this means we should only sell if we make a profit after applying fees, otherwise hold until the price goes up high enough, or sell at a threshold value if it starts plummeting. There is also a third parameter to cope with, that is the risk itself. Every minute that we keep holding assets, we are increasing therisk of devaluation, because the price may plummet and nothing we can do about it. But then again, sometimes a setback is a setup for a comeback, this means we must ensure our system does not sell too soon.
But what if, after many months and countless of sleepless nights, this short-term strategy just doesn’t work well? Then we’ll have to transition to a longer-term strategy, a more diversified portfolio and cope with even higher risks. If I may speculate, I believe it’s even harder to develop an algorithmic longer-term strategy than a short-term one, simply because of much higher uncertainty and risks involved.
You may realize that it’s impractical to develop a good trading strategy by using some trading indicator. In reality it comes down to using multiple variables and different trading indicators in synergy. A different approach is to use artificial intelligence, which is less error-prone and more promising than the former. So stay tuned for the next post and some cool A.I. stuff.
Thank you for reading!
- Ilya
Forecasting Bitcoin prices in the short-term
In this post I will reveal some of our secrets as to how we use Artificial Intelligence, by means of machine learning, to pretty accurately predict the price of Bitcoin in the short-term. Since we refer to short-term as up to two hours, we are able to make pretty accurate trend predictions. However, the further into the future we try to predict, the less accurate results we obtain. Since the crypto space is very volatile and highly unpredictable, short-term forecasting remains our most realistic approach.

In my previous post I’ve explained and addressed some of our shortcomings. As of today, I will no longer use aggregated average prices from various exchanges, but instead use realistic price data from one specific exchange, and if any back testing is carried out then it will always incorporate the trading fees — unless explicitly mentioned otherwise.
The goal
We know for a fact that some investing firms invest heavily in R&D to develop A.I. based trading algorithms and models. And we also know that they are making a profit by doing that, otherwise they wouldn’t be doing it. This also means that smaller organizations (like ours) can do that as well, but on a smaller and more controlled scale.
We have been developing machine learning systems to forecast cryptocurrency prices and trends for a couple of months now. The results of our efforts, as you can read in previous posts, have been eye opening already. But since recently we took it one step further and improved our systems, as you’ll read below.
Short-term Bitcoin predictions
Below are two screenshots that illustrate our current prediction results. On these charts, the dark black line is the historic price; the gray line is the actual future price, we know this future price because I’m looking at results that were generated two hours ago. The red/green/orange lines are a summary of the predictions. Since we generate a multitude of predictions, we only want to see a handful of them, so we only show the most optimistic, pessimistic and the average prediction.
Both of these charts depict predictions of the price for 8 intervals into the future, with each interval being 10 minutes. So that is 1h20m (80minutes) into the future:
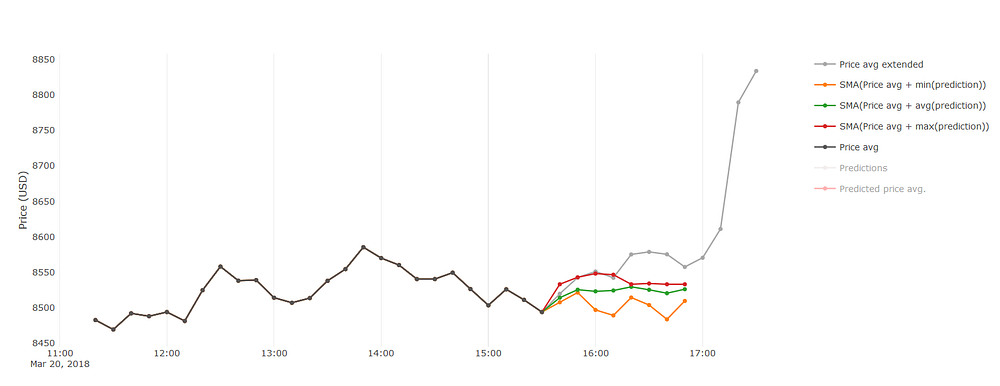
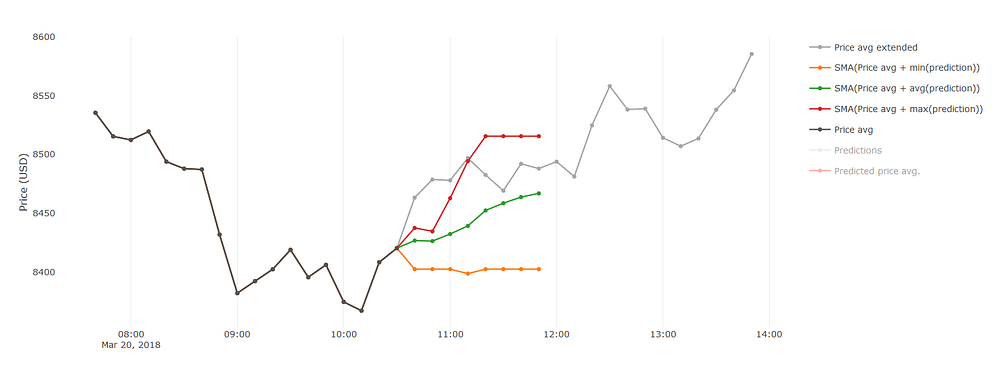
It’s important to remember that the absolute value of these predictions don’t matter as much as their general trend. These predictions are generated by a complex mathematical model, so their absolute value may deviate from reality. However, we instead use these as a tool to forecast whether the price will go up, down or stay as is. And coming back to our initial remarks, the reason why the absolute value of the predictions are of even lesser importance is that the prices are aggregated averages from all major exchanges — the predictions are not targeting one specific exchange.
On a side note — I’ve often been asked by readers if the predictions are over fitted, the answer is they are not. Our neural network systems are initially trained on a large data set, and from then on it uses data from the previous intervals (e.g. past 10 minutes) to re-train the neural network and make these predictions for the next 8 intervals. So we never generate predictions over a date range that has already been used for training, otherwise that would no longer be considered as “forecasting”.
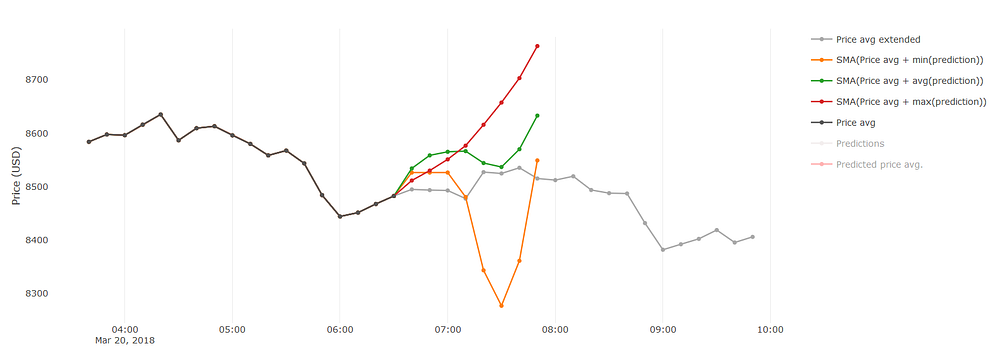
From the two screenshots above, the predictions appear to be pretty accurate, and in many cases they are. But in some cases they are not. Have a look at the next chart where the predictions deviate immensely. The optimistic prediction shows the price going up exponentially, the average one looks more sinusoidal and the pessimistic prediction indicates a huge drop with a strong recovery afterwards. These predictions look very anomalic to us humans, but for the system they are no different, so to improve or filter them out we need to understand better how A.I. works. Unless we fully understand why it makes such predictions, we cannot improve them — and learning how A.I. makes decisions requires yet another A.I. component to do just that, this remains work in progress.
Realistic Bitcoin predictions
As briefly mentioned previously, we no longer use aggregated average price data. Instead we shall focus on one (or multiple) crypto exchanges. At this stage we solely use the Binance exchange for our purposes, we are not affiliated with that company in any way.
About a week ago I started using one-minute candlesticks as input data for our neural network. Initially it yielded no meaningful results, after struggling for two whole days trying to tweak a whole bunch of parameters, I just put it aside and focused on different parts of our project.
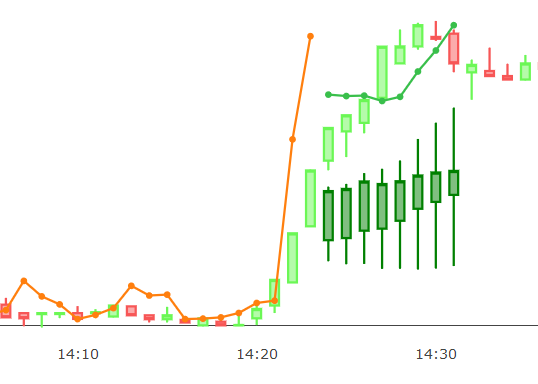
But then I realized that I was trying to solve a problem using an old mindset. The old mindset is to make eight predictions, which yielded pretty “okay” results on the aggregated price data, but not necessarily on the Binance data using 1 minute candlesticks. So I had to redesign this little detail, and instead of making 8 predictions, I made it predict just one. I then also realized that having just one prediction will be a visual disaster, it tells us very little (from a visual perspective), because we’ll only see just one dot. To cope with this, I also made sure the system includes previously made predictions, now we can actually have a graph (a solid line, with multiple dots); this is something we can analyze and benchmark against the actual price. This new method for visualizing predictions looks like on the image below.
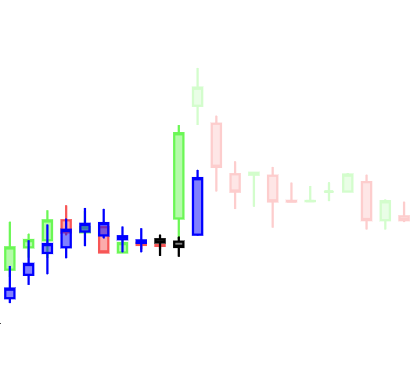
On the image there are two actual prices, the solid green/red candlesticks which are the historic prices (these were used as input for the neural net), while the slightly faded (lowered opacity) green/red candlesticks are the future price — this screenshot was taken at some historic time where the future price is already known so these candlesticks are present (with their opacity lowered). The blue/black candlesticks are the predictions made for their respective interval, given only the data prior to that interval. So in this example the last big “blue” candlestick is the result of the previous large green “candlestick”. The A.I. system has learned that the previous interval had a huge increase in price, so it predicts that the next interval will be an increase as well (compared to the previous prediction).
It actually depends on how we look at it and phrase it, some people may say that the price is about to go down if we use absolute values — while if we use the predictions as trends then it tell us the price is going to increase. Which of these two views/theories is most correct remains to be tested (i.e. back testing), there’s actually no trivial answer to this question. So for now it will be a combination of both looking at the trend and at the absolute values. Here’s a more complete image of the above:
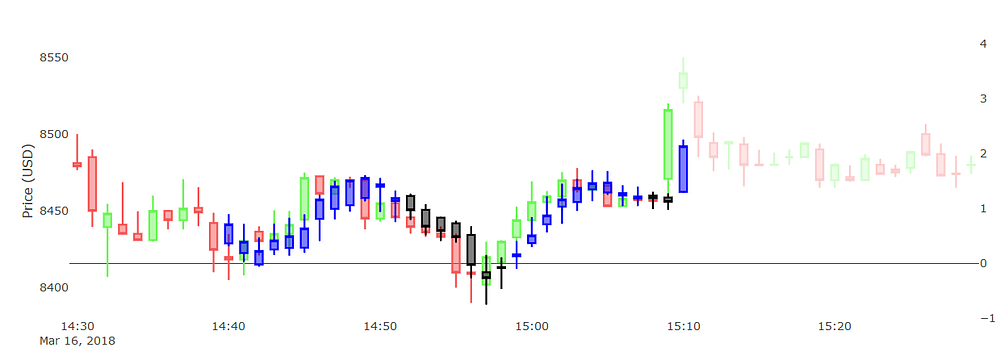
We clearly see how pretty accurate the trend of the predictions were compared to that of the price. This is what opened my eyes and allowed me to continue my research much deeper. Below is another screenshot generated in the same fashion, same data, but vastly different parameters and neural network structure:
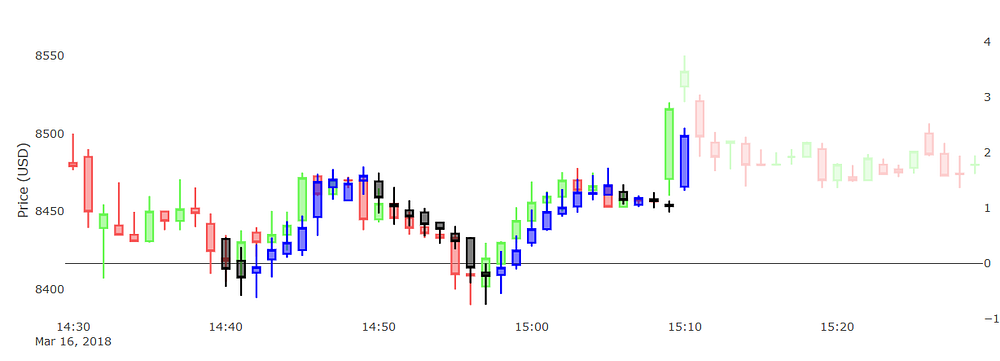
We see that its results/predictions are quite similar to the first one. I actually like this one better (on first sight), because it has more “black” candlesticks (i.e. the close price was lower than open price). This one also looks slightly more over fitted, because its values appear to be closer in absolute terms. But as mentioned earlier, these prediction regions were not used as input to train the neural net so they are not directly biased,they are simply more accurate predictions in absolute terms — taking this statement into consideration, it’s amazing how well the system makes these one-interval predictions.
You may also have noticed that the system is not able to predict huge increases/drops in price, such as that big “green” candlestick, there is no way the system could predict that. And these increases are usually due to market manipulation (e.g. insider trading) or a group of people deciding to to buy loads of BTC during that interval — unless we have access to these groups, we cannot develop a system that forecasts these scenarios. But we do see that our system learns and adapts from these anomalies, it learns that after a huge increase (or decrease) comes either stability, even more growth or a sudden drop.
Having done this, I moved to the next level, increasing the interval size. So instead of predicting 1 minute ahead, let us use 5-minute interval candlesticks and predict 5 minutes ahead (which is still a single interval prediction in this case). Below are two screenshots with predictions generated by different neural nets for the same period:
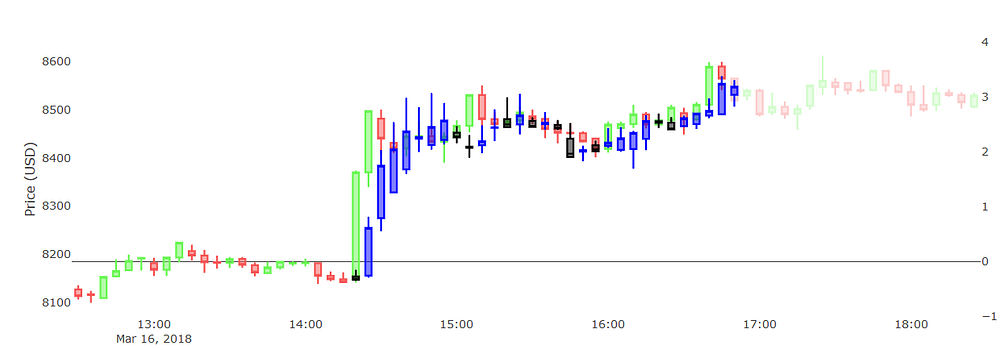

From the two above predictions we see that the first one looks smoother, but also somewhat less accurate. The second one resembles the reality slightly better. Then again, notice how inaccurate it is for detecting anomalies, as described earlier:
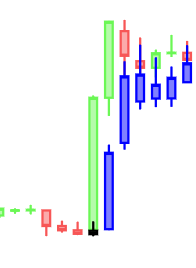
Given the historical data, there is no indicator, i.e. there is no way the system can know the price will shoot up extremely fast/high (relative to the previous values), as shown on the above. So the prediction for the larger “green” candlestick is a tiny “black” candlestick indicating the price will be relatively stable, but instead it went up (a lot). Once again this proves our point, it’s practically not possible to predict such a scenario given our data — but fortunately the system is “learning” and can indicate what will happen after the price goes up as it did, we then can use these predictions to decide whether to buy/sell/hold.
Below is another example of 5-min interval predictions, this time I used yet another set of parameters and data set size. Notice how the shape/trend of these predictions differs from the previous ones.
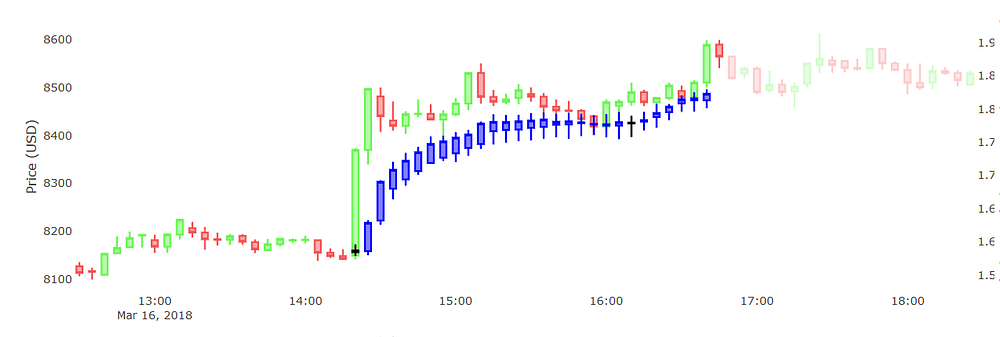
If we can make pretty “okay” predictions with 5-min candlesticks, why not with 10-min ones? That’s why I did next to see how accurate these would be, and here is one of those results:
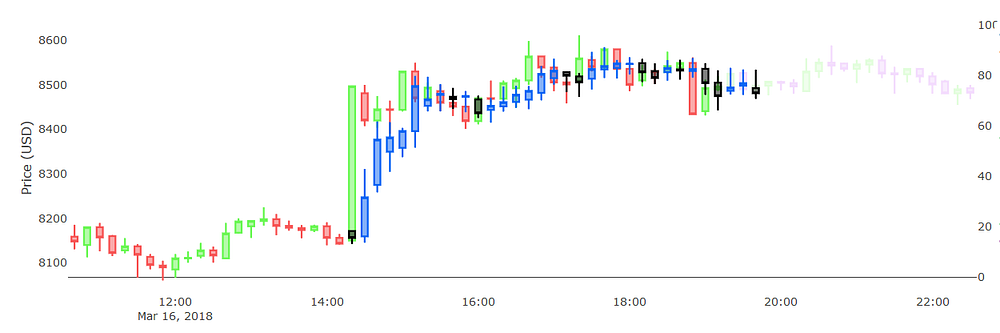
We clearly see that the 10-min predictions are slightly less accurate compared to the 5-min ones, the major trend is still there — but it’s still unable to predict huge rises/drops as explained before. I did not go any further to predicting 20, 30, 60, … minute intervals simply because I shifted my focus to a next important matter.
Remember that I started of this chapter by explaining how I went from making 8-step predictions to just single step ones? That decision was not backed my experiments, there was actually nothing less accurate from the 8-steps compared to the 1-steps, that is if we only look at the very first prediction. But the confusing part was the other 7 predictions, since these usually deviate a lot from the actual future, and it made the results appear very inaccurate. The thing is, every new prediction has even lesser precision than the previous one. This I realized when I went from single step predictions to three step ones:
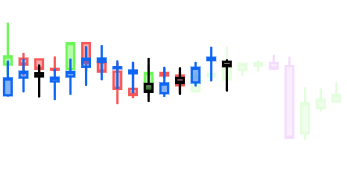
I realized that making 3-step ahead predictions appeared to be pretty accurate, more accurate than 8-step predictions to say the least. But then again, it wasn’t always the case:
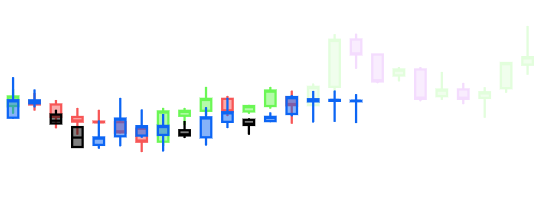
Making multi-step predictions is done by using, in our system at least, the previously made prediction as the new input. And if the previous prediction wasn’t accurate then the next one won’t be either (in most of the cases). The reason behind this is that every prediction has an error percentage%, this error value grows exponentially at each new prediction step.
A deeper neural networks
It’s generally true that the depth/size of a neural network can improve (or degrade) the results. Until now I have always been using pretty shallow neural networks with just one or two hidden layers, and a handful of neurons per layer. But what would the results be like if I used a deeper neural network, for instance three to six hidden layers? I am not going to go very deep into deeper neural networks (DNNs), simply because the results are too “deep” to understand at this point. However I would like to share some cool findings. In the next few examples I trained DNNs and let it predict 16-step intervals, in the hope of finding something interesting.
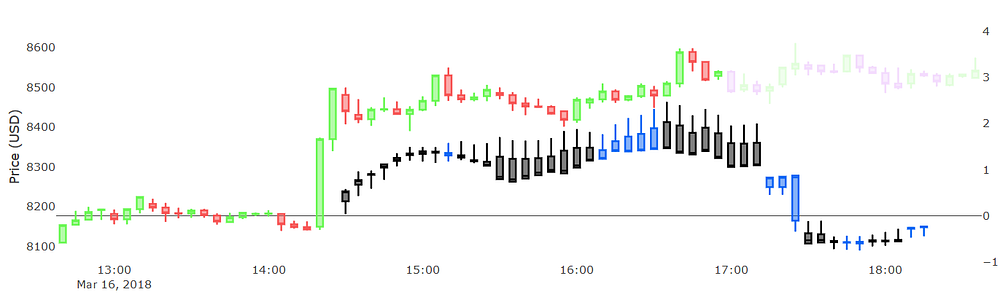
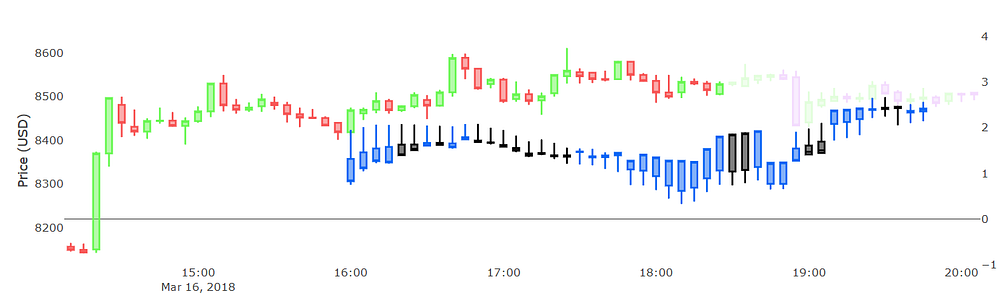
Most results from our DNNs look way smoother than those from shallow NNs. But I also noticed that sometimes these DNNs produce very surprising and unexpected results. On the chart above we see how the system predicts a drop in price midway 17:00. Even though such as thing did not occur reality, it was still a fascinating anomaly.
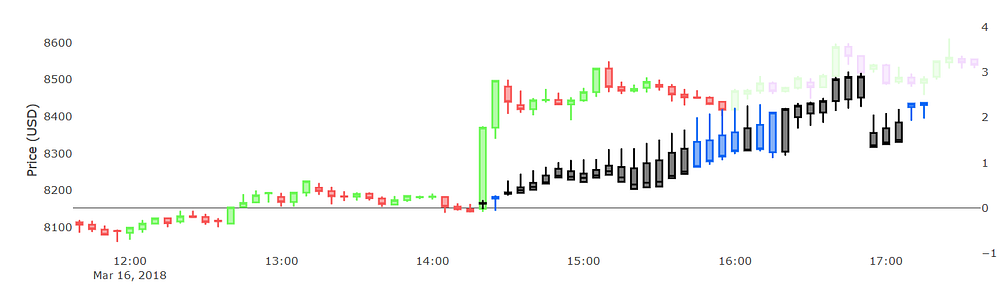
Here’s another set of predictions, where at some point the system predicts the price to go up steadily in linear fashion, but then shortly before 17:00 it indicates a drop. If we compare this against how the price evolved in reality, we see something quite similar happening. The price did rise steadily until like 16:40 and then it dropped until 17:15 before going up again for a short period. In some way this can be seen in the predictions, but whether it’s the true meaning of these predictions is up for debate.
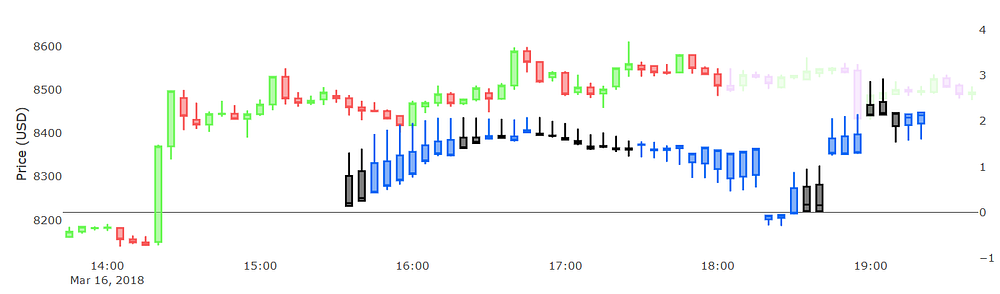
In the above it appears the system is anticipating for a huge drop midway 18:00 to 19:00. In reality no drop occurred in that range, except at 18:55.
I followed the previous prediction, and a few steps later it still kept anticipating for this huge drop. But now this drop has shifted closer to 19:00. And in reality there was indeed a drop in price, followed by a steady increase right afterwards, at 18:55 that is. So whether the system was really predicting this drop or not remains unclear, but it’s definitely surprising to see that manifest!
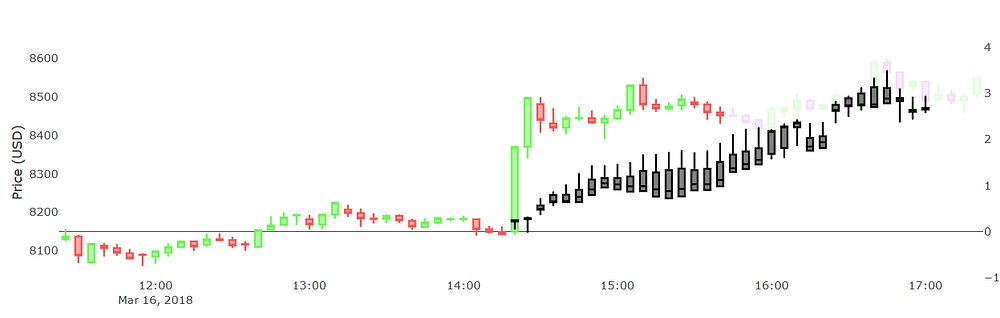
Above is another interesting version. In this case every prediction is “black” (i.e. red candlestick). I cannot explain why, but it does appear to make a good prediction of the price’s trend between 16:00 and 17:00 nonetheless.
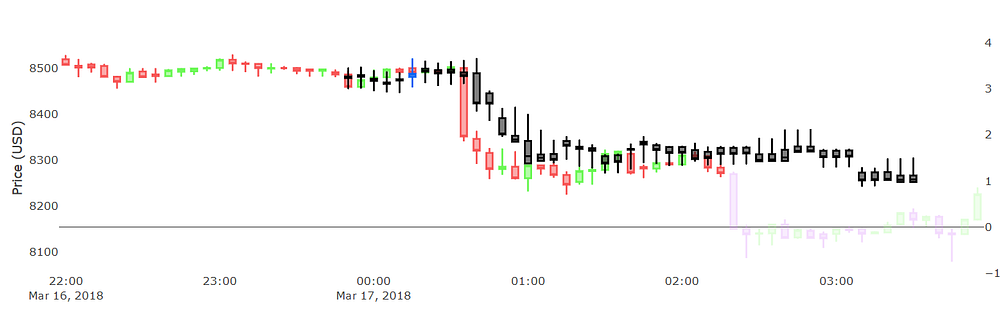
Above is a region where the system did not anticipate a huge drop that is about to come next (at 02:10 or so).
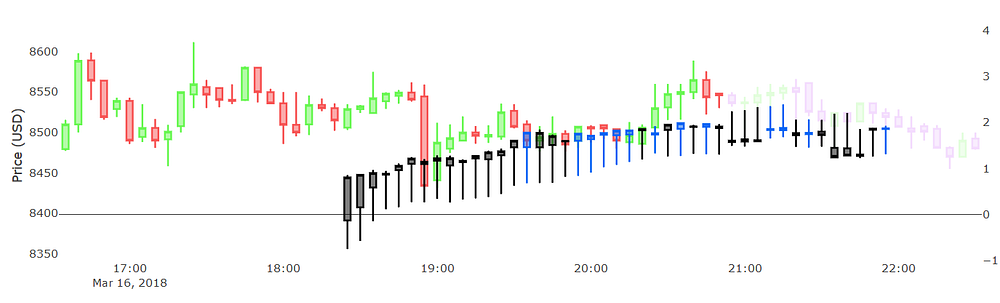
Sometimes there are DNNs that just look weird to say the least (as the one below). Even though they look strange to us, they may contain valuable information that the A.I. system is trying to tell. We just need a better way of interpreting its output.
Conclusion
We’ve learned that there are many parameters that influence the shape and value of the predictions. Until now we have not yet figured out which parameters are the best — eventually there will be no definite set of parameters that are “the best”. The reason is that the market is ever changing, so to optimize for maximum profit, we’ll have to continuously change and optimize these all of these parameters as well. That’s one of the reasons why our current auto-predictions system generates multiple forecast graphs as explained in the intro. To validate which parameters are best suited within a certain period (i.e. certain market state), we’ll need a good way to back test the predictions.
The next important matter is how do we correctly use these predictions as an investment model and strategy? How can we use the predictions to generate trading signals (i.e. buy/sell/hold)? These will always remain ongoing questions subject to research, however in the next post I will already reveal some parts of our research.
Thank you for reading and stay tuned for the next update!
- Ilya
Back in December 2017, when I started this entire operation, an old friend and client of mine took high interest in what I was about to do. Since then we’ve been talking a lot and he’s been closely following my progress. About a month ago we agreed to meet each other and transcend our relationship to a new level — he so kindly invited me to visit him in NYC to talk about this business. I never imagined this project alone would take me global. Anyways, about two weeks ago I got on the airplane and since then we had an amazing time together.
He introduced me to some of his dear friends, clients and investors, and most of them were very into this new era of digital currencies and the future blockchain technologies. This was one of the most important lessons I’ve learned, business wise, the blockchain and crypto hype is very real. It’s not just some artificial hype created by influencers and/or big corp, that I am used to read about on social media. People are genuinely investing and building it in tech communities all over the world. Since so many are doing it, it’s hard to imagine for it to just disappear overnight, but it doesn’t mean you should become a full-time investor just yet. Even though the market is highly unregulated, regulations are being put in place — only time can tell what the future will bring, unfortunately I can’t predict that
.
Addressing my mistakes
If you’ve been following my progress closely, including the analyses, you will know that the crypto prices I’ve used until now are the average of all mainstream exchanges. Whether you use the app or the desktop website, the prices were always the average of all major exchanges, e.g.:look at the chart with avg. BTC price in orange.
If you are a long term investor, then it doesn’t matter to you if BTC is worth 0.5% more on exchange A than on exchange B. But if you are a day trader then you want to know the exact price on your exchange. Using average prices in my analyses should be considered as a mistake, especially since I am back testing various models and trading strategies on that data. It’s a mistake because we cannot actually buy/sell Bitcoin (or any other coin) using the average price on any exchange at all. The actual buy/sell price will (almost) always differ from the average price. You may wonder why bother about a small variation of merely 0.5%? It does matter a great deal in algorithmic trading, since in the end it is one of my goals to establish a fully (or pseudo) automatic trading system.
A second major issue that I’ve deliberately not incorporated were the trading fees. I have not done this because of the first issue: I was using the average prices, so for simplicity reasons I’ve left them out. Instead I should’ve calculated the average trading fee across all used exchanges or chosen an arbitrary fee such as 0.1% for both buy and sell trades.
To address these issues, first and foremost I started pulling data from a specific exchange, instead of a third-party API that aggregates crypto data. Since I am a Binance user myself (and not affiliated in any other way), I am going to use Binance in the near future for my analyses and machine learning works. The average prices will remain as is, and will not be replaced by any specific exchange. Instead, in the long run I am going to include all major exchanges such that traders can plug-in to whichever exchange they are using. Each exchange also has a clearly defined fee structure, so for back testing I can include them and produce very accurate results.
After having done the above, I re-ran my previous models and strategies through the back testing system. The ROIs were pretty terrible to say the least. I you look at our previous back testing results, until now the ROIs (without fees and with average prices) were in the range of 5–15%, but are now between 0% and -15% (or worse). Thus in reality our current models and strategies are losing more money than they are making. The reason became apparent pretty quickly, our systems were making a lot of short-term trades. These trades made a small marginal profit, and over a long period (of e.g. 14 days) yield up to 40% returns — however, if we incorporate trading fees for every buy and sell action, these marginal profits become marginal losses.
Short-term profits versus long-term holds
Building an automatic trading bot/tool is child’s play and you can even find many GitHub projects if you don’t want to reinvent the wheel. All they do is connect to your favorite exchange and then buy/sell depending on when you program them to. But the latter is the most difficult part — developing a good model, a good trading strategy is a completely different story.
Major trading institutions invest huge amounts trying to improve theirs. The reality is that no perfect strategy will ever be invented for an unpredictable market. But as we have been doing until now, one can increase its win rates from 50% to 60%, this is the whole purpose of making predictions by means of machine learning. If one can make predictions that are more spot-on than not, then you can make a profit in the long run.
Coming back to our project, the major question is: should we focus on making marginal profits or shift our focus to longer term investments? Eventually it will be a combination of both, but right now I am focusing solely on the short-term strategy.
My reasoning is simple: a few months ago I realized that there exist many golden opportunities (almost) every day, within these windows we can make a at least 0.5% (up to 4%) ROI on a single trade. This is indicated on the candlestick chart above. Almost every single day there are short periods where the price rises up very quickly. Afterwards it either stabilizes or drops down again. In this case, if we can detect such an event we can enter a buy trade for $9100/BTC and then sell at $9300/BTC, this would yield us an ROI of 2–3% (depending on the trading fee %). Even by just catching/detecting one such event every day or two would yield a tremendous ROI on a monthly/yearly basis. In the above we bought at $9100/BTC because it takes time to detect such an event, unless one can predict these to some degree then one can buy at an even lower price (e.g. $9000/BTC) thus increasing the ROI.
If you’ve read my previous posts, you may realize this is exactly what our Anomaly Detection (AD) system is designed for. The back testing results from my AD system were terrific (up to 17% ROI in a very short amount of time), but then again, those results were excluding trading fees. Once I included the fees, the results were actually depressing. After careful analysis, the reason is just as explained earlier: too many marginal trades caused the fees to pile up and drive the ROI down. We should still use the AD system but we have to adjust the strategy, we need to carefully determine when to buy and sell. This means the strategy will become riskier, we should minimize the fees while optimizing the ROI — this means we should only sell if we make a profit after applying fees, otherwise hold until the price goes up high enough, or sell at a threshold value if it starts plummeting. There is also a third parameter to cope with, that is the risk itself. Every minute that we keep holding assets, we are increasing therisk of devaluation, because the price may plummet and nothing we can do about it. But then again, sometimes a setback is a setup for a comeback, this means we must ensure our system does not sell too soon.
But what if, after many months and countless of sleepless nights, this short-term strategy just doesn’t work well? Then we’ll have to transition to a longer-term strategy, a more diversified portfolio and cope with even higher risks. If I may speculate, I believe it’s even harder to develop an algorithmic longer-term strategy than a short-term one, simply because of much higher uncertainty and risks involved.
You may realize that it’s impractical to develop a good trading strategy by using some trading indicator. In reality it comes down to using multiple variables and different trading indicators in synergy. A different approach is to use artificial intelligence, which is less error-prone and more promising than the former. So stay tuned for the next post and some cool A.I. stuff.
Thank you for reading!
- Ilya
Forecasting Bitcoin prices in the short-term
In this post I will reveal some of our secrets as to how we use Artificial Intelligence, by means of machine learning, to pretty accurately predict the price of Bitcoin in the short-term. Since we refer to short-term as up to two hours, we are able to make pretty accurate trend predictions. However, the further into the future we try to predict, the less accurate results we obtain. Since the crypto space is very volatile and highly unpredictable, short-term forecasting remains our most realistic approach.
In my previous post I’ve explained and addressed some of our shortcomings. As of today, I will no longer use aggregated average prices from various exchanges, but instead use realistic price data from one specific exchange, and if any back testing is carried out then it will always incorporate the trading fees — unless explicitly mentioned otherwise.
The goal
We know for a fact that some investing firms invest heavily in R&D to develop A.I. based trading algorithms and models. And we also know that they are making a profit by doing that, otherwise they wouldn’t be doing it. This also means that smaller organizations (like ours) can do that as well, but on a smaller and more controlled scale.
We have been developing machine learning systems to forecast cryptocurrency prices and trends for a couple of months now. The results of our efforts, as you can read in previous posts, have been eye opening already. But since recently we took it one step further and improved our systems, as you’ll read below.
Short-term Bitcoin predictions
Below are two screenshots that illustrate our current prediction results. On these charts, the dark black line is the historic price; the gray line is the actual future price, we know this future price because I’m looking at results that were generated two hours ago. The red/green/orange lines are a summary of the predictions. Since we generate a multitude of predictions, we only want to see a handful of them, so we only show the most optimistic, pessimistic and the average prediction.
Both of these charts depict predictions of the price for 8 intervals into the future, with each interval being 10 minutes. So that is 1h20m (80minutes) into the future:
Prediction results 1
Prediction results 2
It’s important to remember that the absolute value of these predictions don’t matter as much as their general trend. These predictions are generated by a complex mathematical model, so their absolute value may deviate from reality. However, we instead use these as a tool to forecast whether the price will go up, down or stay as is. And coming back to our initial remarks, the reason why the absolute value of the predictions are of even lesser importance is that the prices are aggregated averages from all major exchanges — the predictions are not targeting one specific exchange.
On a side note — I’ve often been asked by readers if the predictions are over fitted, the answer is they are not. Our neural network systems are initially trained on a large data set, and from then on it uses data from the previous intervals (e.g. past 10 minutes) to re-train the neural network and make these predictions for the next 8 intervals. So we never generate predictions over a date range that has already been used for training, otherwise that would no longer be considered as “forecasting”.
From the two screenshots above, the predictions appear to be pretty accurate, and in many cases they are. But in some cases they are not. Have a look at the next chart where the predictions deviate immensely. The optimistic prediction shows the price going up exponentially, the average one looks more sinusoidal and the pessimistic prediction indicates a huge drop with a strong recovery afterwards. These predictions look very anomalic to us humans, but for the system they are no different, so to improve or filter them out we need to understand better how A.I. works. Unless we fully understand why it makes such predictions, we cannot improve them — and learning how A.I. makes decisions requires yet another A.I. component to do just that, this remains work in progress.
Prediction results 3
Realistic Bitcoin predictions
As briefly mentioned previously, we no longer use aggregated average price data. Instead we shall focus on one (or multiple) crypto exchanges. At this stage we solely use the Binance exchange for our purposes, we are not affiliated with that company in any way.
About a week ago I started using one-minute candlesticks as input data for our neural network. Initially it yielded no meaningful results, after struggling for two whole days trying to tweak a whole bunch of parameters, I just put it aside and focused on different parts of our project.
Initial candlestick predictions of 8 steps (1min intervals)
But then I realized that I was trying to solve a problem using an old mindset. The old mindset is to make eight predictions, which yielded pretty “okay” results on the aggregated price data, but not necessarily on the Binance data using 1 minute candlesticks. So I had to redesign this little detail, and instead of making 8 predictions, I made it predict just one. I then also realized that having just one prediction will be a visual disaster, it tells us very little (from a visual perspective), because we’ll only see just one dot. To cope with this, I also made sure the system includes previously made predictions, now we can actually have a graph (a solid line, with multiple dots); this is something we can analyze and benchmark against the actual price. This new method for visualizing predictions looks like on the image below.
New predictions representation
On the image there are two actual prices, the solid green/red candlesticks which are the historic prices (these were used as input for the neural net), while the slightly faded (lowered opacity) green/red candlesticks are the future price — this screenshot was taken at some historic time where the future price is already known so these candlesticks are present (with their opacity lowered). The blue/black candlesticks are the predictions made for their respective interval, given only the data prior to that interval. So in this example the last big “blue” candlestick is the result of the previous large green “candlestick”. The A.I. system has learned that the previous interval had a huge increase in price, so it predicts that the next interval will be an increase as well (compared to the previous prediction).
It actually depends on how we look at it and phrase it, some people may say that the price is about to go down if we use absolute values — while if we use the predictions as trends then it tell us the price is going to increase. Which of these two views/theories is most correct remains to be tested (i.e. back testing), there’s actually no trivial answer to this question. So for now it will be a combination of both looking at the trend and at the absolute values. Here’s a more complete image of the above:
1-min interval predictions (1)
We clearly see how pretty accurate the trend of the predictions were compared to that of the price. This is what opened my eyes and allowed me to continue my research much deeper. Below is another screenshot generated in the same fashion, same data, but vastly different parameters and neural network structure:
1-min interval predictions (2)
We see that its results/predictions are quite similar to the first one. I actually like this one better (on first sight), because it has more “black” candlesticks (i.e. the close price was lower than open price). This one also looks slightly more over fitted, because its values appear to be closer in absolute terms. But as mentioned earlier, these prediction regions were not used as input to train the neural net so they are not directly biased,they are simply more accurate predictions in absolute terms — taking this statement into consideration, it’s amazing how well the system makes these one-interval predictions.
You may also have noticed that the system is not able to predict huge increases/drops in price, such as that big “green” candlestick, there is no way the system could predict that. And these increases are usually due to market manipulation (e.g. insider trading) or a group of people deciding to to buy loads of BTC during that interval — unless we have access to these groups, we cannot develop a system that forecasts these scenarios. But we do see that our system learns and adapts from these anomalies, it learns that after a huge increase (or decrease) comes either stability, even more growth or a sudden drop.
Having done this, I moved to the next level, increasing the interval size. So instead of predicting 1 minute ahead, let us use 5-minute interval candlesticks and predict 5 minutes ahead (which is still a single interval prediction in this case). Below are two screenshots with predictions generated by different neural nets for the same period:
5-min interval predictions (1)
5-min interval predictions (2)
From the two above predictions we see that the first one looks smoother, but also somewhat less accurate. The second one resembles the reality slightly better. Then again, notice how inaccurate it is for detecting anomalies, as described earlier:
First prediction fails to predict the price spike
Given the historical data, there is no indicator, i.e. there is no way the system can know the price will shoot up extremely fast/high (relative to the previous values), as shown on the above. So the prediction for the larger “green” candlestick is a tiny “black” candlestick indicating the price will be relatively stable, but instead it went up (a lot). Once again this proves our point, it’s practically not possible to predict such a scenario given our data — but fortunately the system is “learning” and can indicate what will happen after the price goes up as it did, we then can use these predictions to decide whether to buy/sell/hold.
Below is another example of 5-min interval predictions, this time I used yet another set of parameters and data set size. Notice how the shape/trend of these predictions differs from the previous ones.
5-min interval predictions (3)
If we can make pretty “okay” predictions with 5-min candlesticks, why not with 10-min ones? That’s why I did next to see how accurate these would be, and here is one of those results:
10-min interval predictions (1)
We clearly see that the 10-min predictions are slightly less accurate compared to the 5-min ones, the major trend is still there — but it’s still unable to predict huge rises/drops as explained before. I did not go any further to predicting 20, 30, 60, … minute intervals simply because I shifted my focus to a next important matter.
Remember that I started of this chapter by explaining how I went from making 8-step predictions to just single step ones? That decision was not backed my experiments, there was actually nothing less accurate from the 8-steps compared to the 1-steps, that is if we only look at the very first prediction. But the confusing part was the other 7 predictions, since these usually deviate a lot from the actual future, and it made the results appear very inaccurate. The thing is, every new prediction has even lesser precision than the previous one. This I realized when I went from single step predictions to three step ones:
Predicting 3 steps ahead (1)
I realized that making 3-step ahead predictions appeared to be pretty accurate, more accurate than 8-step predictions to say the least. But then again, it wasn’t always the case:
Predicting 3 steps ahead (2)
Making multi-step predictions is done by using, in our system at least, the previously made prediction as the new input. And if the previous prediction wasn’t accurate then the next one won’t be either (in most of the cases). The reason behind this is that every prediction has an error percentage%, this error value grows exponentially at each new prediction step.
A deeper neural networks
It’s generally true that the depth/size of a neural network can improve (or degrade) the results. Until now I have always been using pretty shallow neural networks with just one or two hidden layers, and a handful of neurons per layer. But what would the results be like if I used a deeper neural network, for instance three to six hidden layers? I am not going to go very deep into deeper neural networks (DNNs), simply because the results are too “deep” to understand at this point. However I would like to share some cool findings. In the next few examples I trained DNNs and let it predict 16-step intervals, in the hope of finding something interesting.
Predictions from a deeper neural network (1)
Most results from our DNNs look way smoother than those from shallow NNs. But I also noticed that sometimes these DNNs produce very surprising and unexpected results. On the chart above we see how the system predicts a drop in price midway 17:00. Even though such as thing did not occur reality, it was still a fascinating anomaly.
Predictions from a deeper neural network (2)
Here’s another set of predictions, where at some point the system predicts the price to go up steadily in linear fashion, but then shortly before 17:00 it indicates a drop. If we compare this against how the price evolved in reality, we see something quite similar happening. The price did rise steadily until like 16:40 and then it dropped until 17:15 before going up again for a short period. In some way this can be seen in the predictions, but whether it’s the true meaning of these predictions is up for debate.
Predictions from a deeper neural network (3)
In the above it appears the system is anticipating for a huge drop midway 18:00 to 19:00. In reality no drop occurred in that range, except at 18:55.
Predictions from a deeper neural network (4)
I followed the previous prediction, and a few steps later it still kept anticipating for this huge drop. But now this drop has shifted closer to 19:00. And in reality there was indeed a drop in price, followed by a steady increase right afterwards, at 18:55 that is. So whether the system was really predicting this drop or not remains unclear, but it’s definitely surprising to see that manifest!
Predictions from a deeper neural network (5)
Above is another interesting version. In this case every prediction is “black” (i.e. red candlestick). I cannot explain why, but it does appear to make a good prediction of the price’s trend between 16:00 and 17:00 nonetheless.
Predictions from a deeper neural network (6)
Above is a region where the system did not anticipate a huge drop that is about to come next (at 02:10 or so).
Sometimes there are DNNs that just look weird to say the least (as the one below). Even though they look strange to us, they may contain valuable information that the A.I. system is trying to tell. We just need a better way of interpreting its output.
Predictions from a deeper neural network (7)
Conclusion
We’ve learned that there are many parameters that influence the shape and value of the predictions. Until now we have not yet figured out which parameters are the best — eventually there will be no definite set of parameters that are “the best”. The reason is that the market is ever changing, so to optimize for maximum profit, we’ll have to continuously change and optimize these all of these parameters as well. That’s one of the reasons why our current auto-predictions system generates multiple forecast graphs as explained in the intro. To validate which parameters are best suited within a certain period (i.e. certain market state), we’ll need a good way to back test the predictions.
The next important matter is how do we correctly use these predictions as an investment model and strategy? How can we use the predictions to generate trading signals (i.e. buy/sell/hold)? These will always remain ongoing questions subject to research, however in the next post I will already reveal some parts of our research.
Thank you for reading and stay tuned for the next update!
- Ilya
Last edited by a moderator:
D
Deleted member 969102
Guest
Haven't been keeping up to date with this recently. but just had a quick read through what I missed. Really, really impressive stuff. Sounds like you're in with the right crowd
The buying at 10:00 and 0:00 strategy is really interesting. How are your test trades doing now?
Another thing to consider is how your volume, when you start trading, is going to impact prices. I assume the people you spoke to in NY are pretty heavy-hitters and will have 7-9 figures combined to invest. This is going to be very difficult to do with your models as the volume may be too low to purchase and your buys will undoubtedly change the price in ways your system can't predict.
The buying at 10:00 and 0:00 strategy is really interesting. How are your test trades doing now?
Another thing to consider is how your volume, when you start trading, is going to impact prices. I assume the people you spoke to in NY are pretty heavy-hitters and will have 7-9 figures combined to invest. This is going to be very difficult to do with your models as the volume may be too low to purchase and your buys will undoubtedly change the price in ways your system can't predict.
No need to reinvent the wheel. Try Amibroker, really.
If you have a good programming background you can excel AB in no time.
AI is better used in a different way IMO, for param optimizations. And you use "sweet zones", not fixed numbers.
Plus you always use a Walk Forward approach. Systems should work with Out of Sample data. Common backtests (in sample) have no value.
If you have a good programming background you can excel AB in no time.
AI is better used in a different way IMO, for param optimizations. And you use "sweet zones", not fixed numbers.
Plus you always use a Walk Forward approach. Systems should work with Out of Sample data. Common backtests (in sample) have no value.
healzer
Elite Member
- Jun 26, 2011
- 2,974
- 3,063
Hey, thanks for the commentHaven't been keeping up to date with this recently. but just had a quick read through what I missed. Really, really impressive stuff. Sounds like you're in with the right crowd
The buying at 10:00 and 0:00 strategy is really interesting. How are your test trades doing now?
Another thing to consider is how your volume, when you start trading, is going to impact prices. I assume the people you spoke to in NY are pretty heavy-hitters and will have 7-9 figures combined to invest. This is going to be very difficult to do with your models as the volume may be too low to purchase and your buys will undoubtedly change the price in ways your system can't predict.
The buy at 10:00 sell at 0:00 strategy isn't anything impressive, it's just statistical arbitrage that works for the given dataset within that specific date/time range.
It won't work in reality, definitely not on an exchange, because price today at 10:00 may be much larger than 0:00 in the next few weeks, so it won't work. But I'm pretty sure there is some arbitrage possible within an exchange by leveraging timezones (Asia vs Europe), that's something I may still have to verify.
Finally, the volume thing is very true. It is something we will have to take into consideration. But fortunately there exist several strategies for investing large amounts without pushing the market unexpectedly. Or even better, using it to our own advantage. But these are practices we'll implement in the far future.
have a great day!

ted.mothership
Newbie
- Sep 27, 2016
- 26
- 3
Impressive
healzer
Elite Member
- Jun 26, 2011
- 2,974
- 3,063
Developing Bitcoin algorithmic trading strategies
Developing algorithmic trading models and strategies is no simple task. To make matters worse the current state of crypto is highly volatile and rapidly changing. The market has become war zone due to regulations from the SEC and various governments targeting crypto exchanges. Despite all of the negative news, many traders are making it big in day-trading crypto assets.

In our previous post I wrote about our progress in making short-term predictions. In this post I take it to a next level. I will illustrate our efforts of how we are incorporating the predictions into a successful trading strategy.
Manual modelling
Developing an algorithmic model/strategy usually starts by looking at the raw data but more importantly analysing several indicators such as SMA, MACD, EMA and RSI. The whole point of the process is trying to find some patterns that are pretty obvious to the human eye, but also that these patterns are reoccurring throughout history and hopefully will continue to do so in the future.
In theory
Most strategies are based around making a profit, so people look for ways to detect a valley so they can trigger a “buy” signal, and then let the system wait until there’s a peak to trigger a “sell” signal. This is risky business, since there are no guarantees, i.e.: a system cannot accurately tell (given historical events) whether that market price is at a valley or not — it can only make a calculated guess. And that’s the whole point, we try to make a calculated guess, that is the plausibility of being at a valley/peak and triggering a trading signal (either buy or sell).
In reality
The reality is much more tricky than the theory. A system may indicate it’s at a valley, but a few minutes later the price drops even lower.
If you have ever written code for large software projects then you know that error/failure rate grows in proportion to every new line of code added. This means that the more code you write, the more mistakes/bugs/errors you induce — humans are not perfect, neither are programmers no matter how brilliant. When we write code we usually have a clear goal in mind, thus we know what the output should be given some clearly defined input. But try doing that with input date of (crypto-) assets (e.g. Bitcoin), you’ll quickly realize that it’s not a trivial thing to do. The input is never the same, and we cannot simply rely on a bunch of “if this — do that” code. However, that’s the only language a computer understands, it’s our most reliable tool for the job.
To make our job easier we have to introduce math and statistics to aid us. This is done by creating indicators, as mentioned earlier, such as SMA and MACD. An indicator is a function that takes raw data, transforms it and spits something new out. Indicators make our lives easier in analyzing the raw market data, they allow us to detect/see patterns that we wouldn’t otherwise see. If you know a tad about trading then you’ll know how useful the MACD, long & short SMA plots are.
Since indicators are solely based on historical data, they are not very good at making predictions, but neither completely useless. To illustrate this have a look at the following chart:
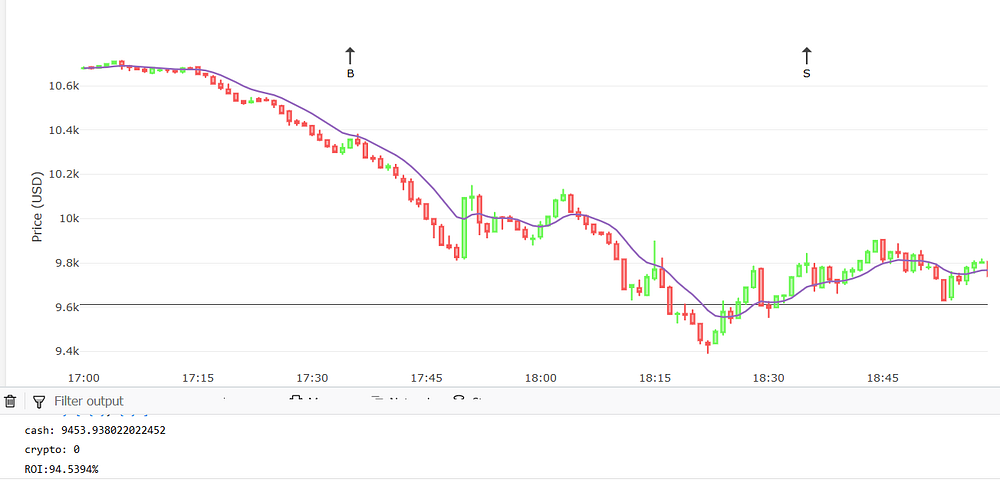
On this chart we can clearly see how a simple algorithm makes decisions. The sad part is that its decisions are not optimal, the reason is apparent since at each step, the algorithm can only look at the past — it cannot foretell the future to make “the best” decision. The other sad part is that such a simple algorithm has hard-coded parameters, such as the indicator’s parameters (e.g. EMA size). To us humans, we may look at these generated signals and say “what a stupid decision” — we cannot argue at all, a machine can only make the decisions we program it to do. If the parameters are sub-optimal, so is the outcome.
At the lower part of the image I indicate the ROI of the generated signals, which is slightly over 94%, meaning the system made a loss of about 6% — reason: it bought higher than it sold, and to make matters worse it paid a 0.1% fee on every trade.
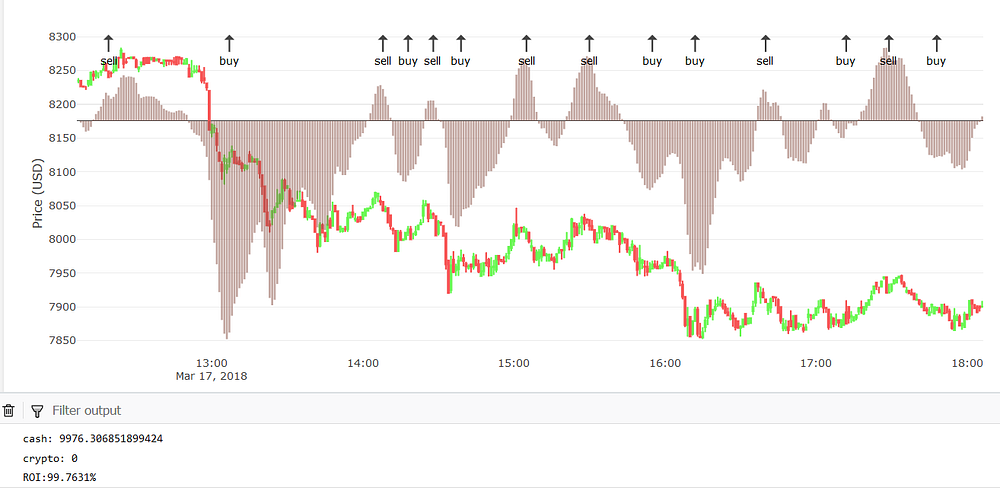
Below is another scenario. This time we use three indicators, but only one is shown. The brown bars represent the MACD indicator, which is built up from two different EMA indicators:
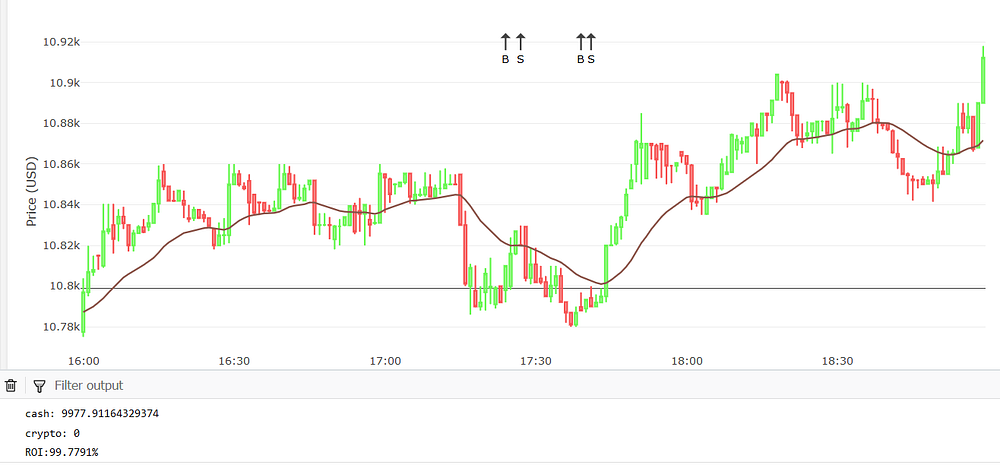
Here’s a third and final example. Below is a chart with signals based on the EMA signal (just like in our first case). But this time I have chosen a different region and more data.
Verifying a strategy
These three examples were based on a very little data. Everything shown on the chart is what was used to generate the trading signals and compute the ROI. In practice, we have to run our algorithm on days, weeks, months or even years worth of data to verify its success rate. Unfortunately very few of these strategies proved to be successful in our tests. Actually, all of the above can generate ROI of over 100% — if there were no trading fees, since that is how exchanges prevent us from becoming millionaires over night.
Deep data
Using raw market data (e.g. price & volume), combined with a few indicators will rarely yield a profitable trading strategy. Unless your algorithm is pretty sophisticated and well-designed — if so re-check everything because you may have a bug or unaccounted for scenario after all.
After a long time and countless attempts I did manage to come up with a few profitable trading algorithms. These were achieved by utilizing some default indicators which I had to adjust in several ways prior to applying. But more importantly, it’s the type of data I use which makes these methods successful. They are no longer based on just the price and/or volume, but take other factors into consideration such as sentiments (from our sentiment analyses).
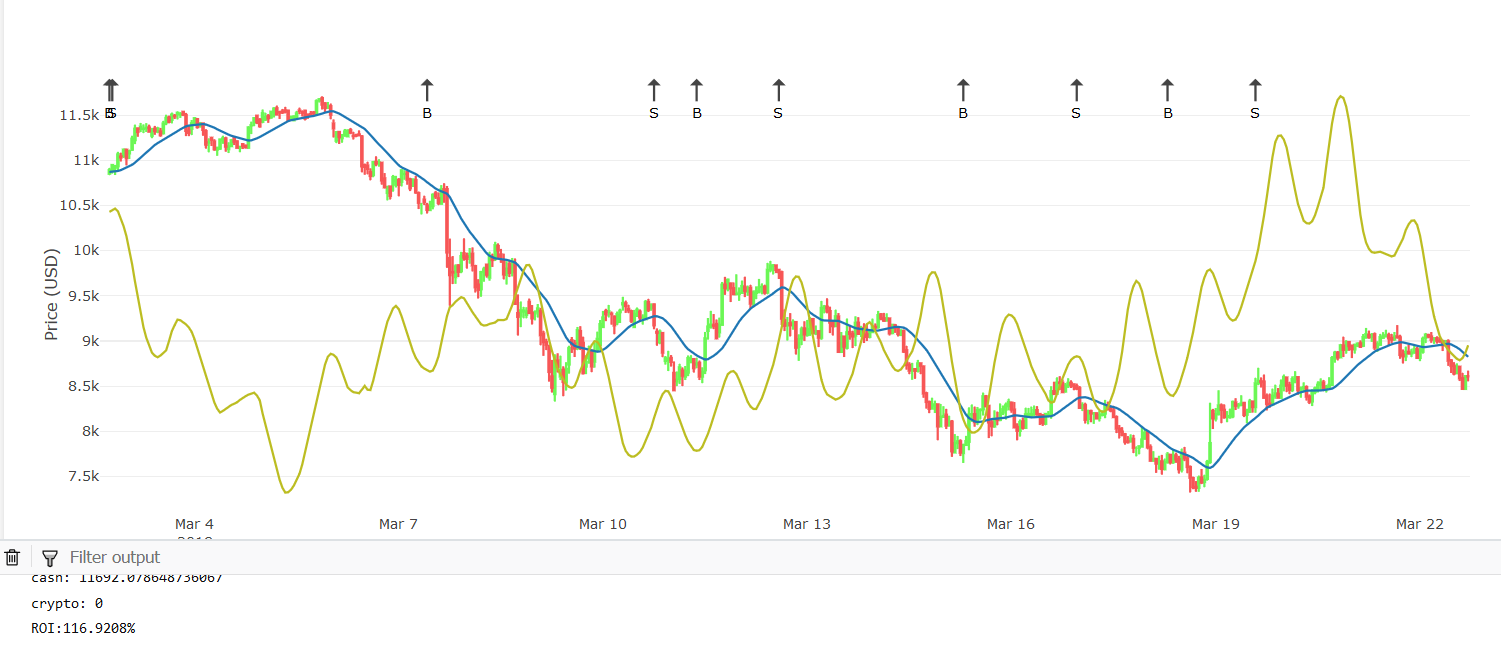
Manual model (4)
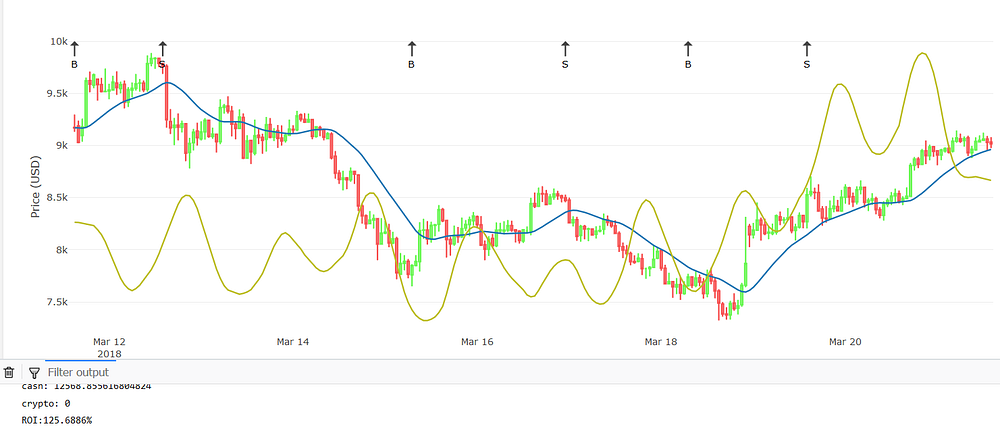
On the chart above you can see one of these strategies in action. Pay close attention to where it generates the Buy/Sell signals — they appear to be way more optimal than in the previous three examples, but far from perfect. An even more important remark is the ROI, it’s positive (116%) and comes down to an average increase of 1% per day.
Below is another chart, which uses the exact same strategy but at a different date/time. Yet again the results are phenomenal with an ROI of 125%, and a daily increase of about 3%.
Artificial Intelligence
One may develop as many models as he/she wishes to, or at least, as many he/she has the guts to. It’s not a straightforward development process. It’s pretty hard to test and verify new hypotheses while simultaneously tweaking its many parameters and trying different values. But what if we can use A.I. to help us come up with even better models and strategies?
This research area is even more complex than creating manual models, but it’s already the future — and if you’re not with it, you’re behind. At some point, if not already, A.I. will make better trading decisions (both long- & short-term) than humans do. If you are an A.I. researcher/developer, you know exactly how complex it is to make a system come up with a trading strategy. It’s already complex enough to train it for carrying out simple tasks such as recognizing objects in pictures.
Hybrid modelling
Until some weeks ago I was using a manually designed strategy which used our predictions to generate trading signals. The results were pretty “okay” at that time, but they did not incorporate trading fees — so they actually are “not so okay” anymore.
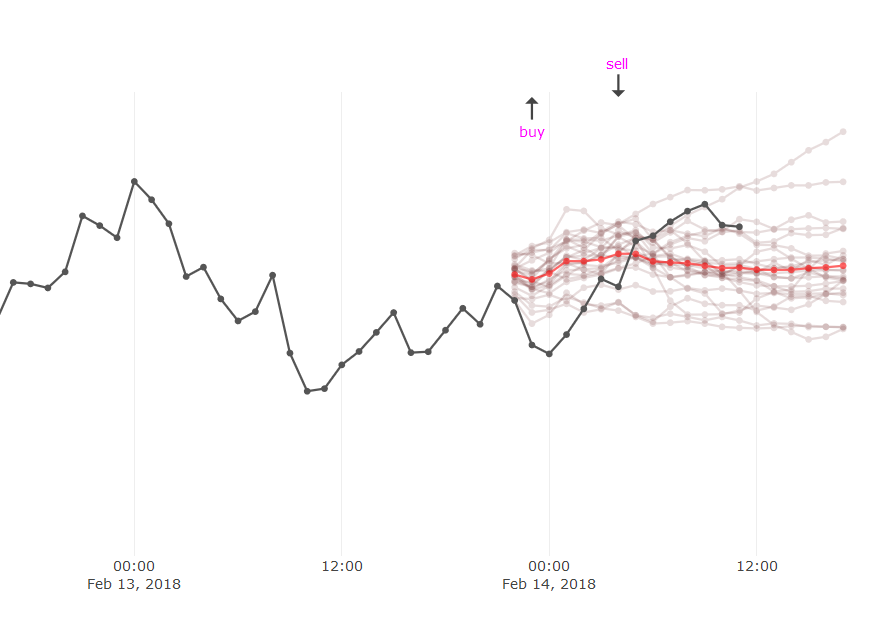
What comes to mind is that these strategies are short-term, meaning they use whatever its predicted to make a decision in the moment. Since our predictions are usually no more than 3 to 15 minutes into the future, they will need to generate large enough margins to pay off the trading fees and thus generate a positive ROI.
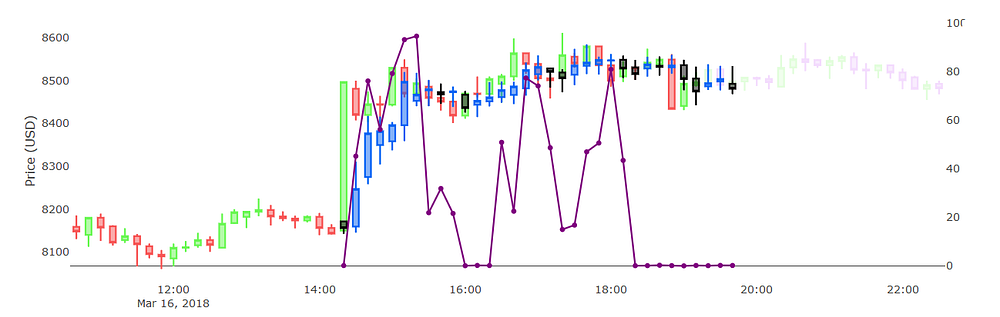
There is one specific thing that I did add into the mix: predicting the next buy/sell signal. I wanted to teach our system to predict worthwhile buy/sell signals, the same way we make it predict the future price. To do this I first had to train the system on what a good buy and good sell position looks like. I did this by going over all the data, and using a look-ahead concept: given a position ‘t’, if in the near-future the price is going to drop a lot then ‘t’ should indicate a ‘sell’ signal — but if the price is going to go up then ‘t’ should instead be a ‘buy’. The near-future was defined by the next 10 or-so intervals. Every other ‘t’ would indicate a ‘do nothing’ signal. Below is a chart that shows the result of my efforts:
Q-learning
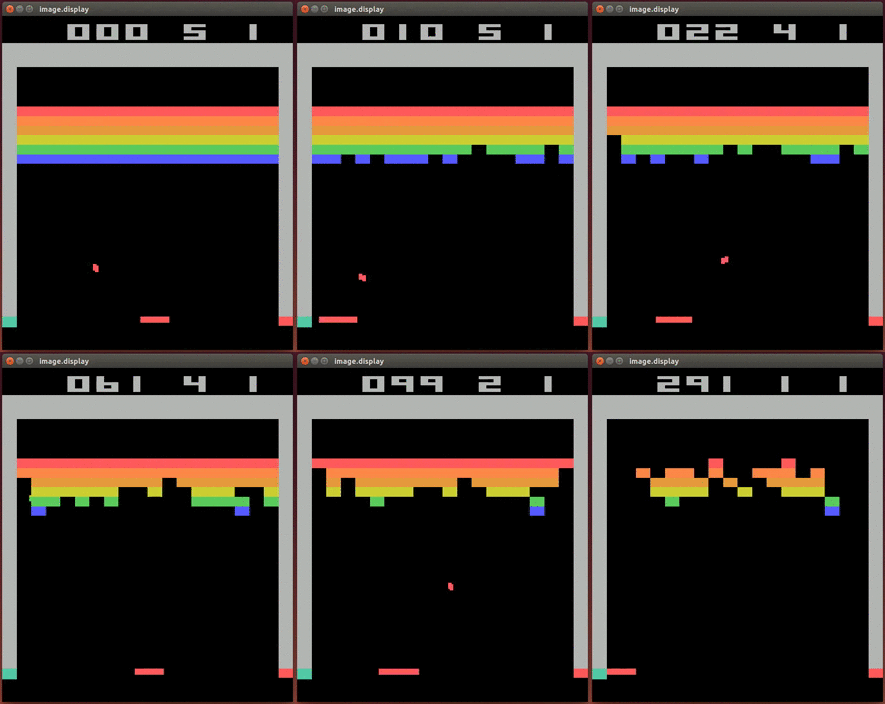
This is a form of reinforcement learning (RL), a technique for training A.I. to do certain stuff. RL is the trick behind teaching a machine how to play chess, Go and even Space Invaders.
The implementation of Q-learning was done by using an open-source project. I only had to tweak & adjust it according to my needs. I also realized that the backbone of Q-learning systems was usually based on a feed forward neural network, I haven’t stumbled upon any solution that used a recurrent neural network instead (yet). But this is what I did implement. I quickly learned that training a system through RL is a very tedious and long process, it takes literally hours/days to complete, depending on the number of iterations and some other factors.
After many painful hours of training I did see some nice buy/sell signals appear, however to me they were more like random than intelligent. Overall Q-learning did not prove to be a successful technique, but I am going to improve it because I believe it’s a gold nugget.
Thank you for reading and stay tuned for the next episode!
- Ilya
Developing algorithmic trading models and strategies is no simple task. To make matters worse the current state of crypto is highly volatile and rapidly changing. The market has become war zone due to regulations from the SEC and various governments targeting crypto exchanges. Despite all of the negative news, many traders are making it big in day-trading crypto assets.
In our previous post I wrote about our progress in making short-term predictions. In this post I take it to a next level. I will illustrate our efforts of how we are incorporating the predictions into a successful trading strategy.
Manual modelling
Developing an algorithmic model/strategy usually starts by looking at the raw data but more importantly analysing several indicators such as SMA, MACD, EMA and RSI. The whole point of the process is trying to find some patterns that are pretty obvious to the human eye, but also that these patterns are reoccurring throughout history and hopefully will continue to do so in the future.
In theory
Most strategies are based around making a profit, so people look for ways to detect a valley so they can trigger a “buy” signal, and then let the system wait until there’s a peak to trigger a “sell” signal. This is risky business, since there are no guarantees, i.e.: a system cannot accurately tell (given historical events) whether that market price is at a valley or not — it can only make a calculated guess. And that’s the whole point, we try to make a calculated guess, that is the plausibility of being at a valley/peak and triggering a trading signal (either buy or sell).
In reality
The reality is much more tricky than the theory. A system may indicate it’s at a valley, but a few minutes later the price drops even lower.
If you have ever written code for large software projects then you know that error/failure rate grows in proportion to every new line of code added. This means that the more code you write, the more mistakes/bugs/errors you induce — humans are not perfect, neither are programmers no matter how brilliant. When we write code we usually have a clear goal in mind, thus we know what the output should be given some clearly defined input. But try doing that with input date of (crypto-) assets (e.g. Bitcoin), you’ll quickly realize that it’s not a trivial thing to do. The input is never the same, and we cannot simply rely on a bunch of “if this — do that” code. However, that’s the only language a computer understands, it’s our most reliable tool for the job.
To make our job easier we have to introduce math and statistics to aid us. This is done by creating indicators, as mentioned earlier, such as SMA and MACD. An indicator is a function that takes raw data, transforms it and spits something new out. Indicators make our lives easier in analyzing the raw market data, they allow us to detect/see patterns that we wouldn’t otherwise see. If you know a tad about trading then you’ll know how useful the MACD, long & short SMA plots are.
Since indicators are solely based on historical data, they are not very good at making predictions, but neither completely useless. To illustrate this have a look at the following chart:
Manual model (1)
In the above we have the price of Bitcoin plotted out as candlesticks. Then I created an indicator (EMA) of some size, based of the Open and Close values. The next step would be to use code, that is “if this — do that” statements, to come up with a basic strategy that would have a positive ROI (incorporating trading fees). Remember my story of peaks & valleys earlier? Well here we see it in action. My algorithm uses the EMA indicator to generate a first buy signal (indicated by ‘B’ on the chart), in this case it’s designed to anticipate a valley, because after rain usually comes sunshine. However, after this buy no sun came, but only more rain (the price kept going down). And then later a sell signal is generated at some local peak.On this chart we can clearly see how a simple algorithm makes decisions. The sad part is that its decisions are not optimal, the reason is apparent since at each step, the algorithm can only look at the past — it cannot foretell the future to make “the best” decision. The other sad part is that such a simple algorithm has hard-coded parameters, such as the indicator’s parameters (e.g. EMA size). To us humans, we may look at these generated signals and say “what a stupid decision” — we cannot argue at all, a machine can only make the decisions we program it to do. If the parameters are sub-optimal, so is the outcome.
At the lower part of the image I indicate the ROI of the generated signals, which is slightly over 94%, meaning the system made a loss of about 6% — reason: it bought higher than it sold, and to make matters worse it paid a 0.1% fee on every trade.
Below is another scenario. This time we use three indicators, but only one is shown. The brown bars represent the MACD indicator, which is built up from two different EMA indicators:
Manual model (2)
The basic idea behind using MACD as a trading strategy, is to yet again, detect peaks & valleys. This becomes apparent when you look at where the buy/sell signals appear, i.e. at some local MACD’s peak/valley. This strategy appears to work better than the previous one, since the ROI is over 99% (i.e. it still made a loss of about 1%) — but we may not compare the two just like that because the previous example only had two trading signals and this one has way more.Here’s a third and final example. Below is a chart with signals based on the EMA signal (just like in our first case). But this time I have chosen a different region and more data.
Manual model (3)
The ROI in the above is over 99%, just like in the case of our MACD. A closer look at the signals is pretty fascinating, it made two short buy/sell trades, which are only a few minutes apart. In this case I tried to let the system make a profit in a very short amount of time by leveraging the high volatility.Verifying a strategy
These three examples were based on a very little data. Everything shown on the chart is what was used to generate the trading signals and compute the ROI. In practice, we have to run our algorithm on days, weeks, months or even years worth of data to verify its success rate. Unfortunately very few of these strategies proved to be successful in our tests. Actually, all of the above can generate ROI of over 100% — if there were no trading fees, since that is how exchanges prevent us from becoming millionaires over night.
Deep data
Using raw market data (e.g. price & volume), combined with a few indicators will rarely yield a profitable trading strategy. Unless your algorithm is pretty sophisticated and well-designed — if so re-check everything because you may have a bug or unaccounted for scenario after all.
After a long time and countless attempts I did manage to come up with a few profitable trading algorithms. These were achieved by utilizing some default indicators which I had to adjust in several ways prior to applying. But more importantly, it’s the type of data I use which makes these methods successful. They are no longer based on just the price and/or volume, but take other factors into consideration such as sentiments (from our sentiment analyses).
Manual model (4)
On the chart above you can see one of these strategies in action. Pay close attention to where it generates the Buy/Sell signals — they appear to be way more optimal than in the previous three examples, but far from perfect. An even more important remark is the ROI, it’s positive (116%) and comes down to an average increase of 1% per day.
Below is another chart, which uses the exact same strategy but at a different date/time. Yet again the results are phenomenal with an ROI of 125%, and a daily increase of about 3%.
Manual model (5)
This strategy I continue to test, validate and optimize to this day — it appears to be the best I’ve been able to come up with thus far. Notice how far apart the buy and sell signals are compared to our previous examples. Here they are many hours or even several days apart, while previously it was just minutes or a few hours. Before I sell my kidney and go all-in, I need to make sure it will really work. Hopefully within a few weeks I’ll plug it in and write a new post showing my results.Artificial Intelligence
One may develop as many models as he/she wishes to, or at least, as many he/she has the guts to. It’s not a straightforward development process. It’s pretty hard to test and verify new hypotheses while simultaneously tweaking its many parameters and trying different values. But what if we can use A.I. to help us come up with even better models and strategies?
This research area is even more complex than creating manual models, but it’s already the future — and if you’re not with it, you’re behind. At some point, if not already, A.I. will make better trading decisions (both long- & short-term) than humans do. If you are an A.I. researcher/developer, you know exactly how complex it is to make a system come up with a trading strategy. It’s already complex enough to train it for carrying out simple tasks such as recognizing objects in pictures.
Hybrid modelling
Until some weeks ago I was using a manually designed strategy which used our predictions to generate trading signals. The results were pretty “okay” at that time, but they did not incorporate trading fees — so they actually are “not so okay” anymore.
Old predictions (1)
One of these strategies was to look at the highest and lowest prediction points and generate a sell/buy signal at these respective intervals. When you think about it, it’s definitely not going to be an optimal strategy by far. One may just as well start buying/selling randomly and have more luck through that. But I wouldn’t throw this idea in the garbage just yet. In my previous post I’ve illustrated our recent improvements of the predictions. So it’s definitely worth a shot re-running this old strategy on some new data.What comes to mind is that these strategies are short-term, meaning they use whatever its predicted to make a decision in the moment. Since our predictions are usually no more than 3 to 15 minutes into the future, they will need to generate large enough margins to pay off the trading fees and thus generate a positive ROI.
There is one specific thing that I did add into the mix: predicting the next buy/sell signal. I wanted to teach our system to predict worthwhile buy/sell signals, the same way we make it predict the future price. To do this I first had to train the system on what a good buy and good sell position looks like. I did this by going over all the data, and using a look-ahead concept: given a position ‘t’, if in the near-future the price is going to drop a lot then ‘t’ should indicate a ‘sell’ signal — but if the price is going to go up then ‘t’ should instead be a ‘buy’. The near-future was defined by the next 10 or-so intervals. Every other ‘t’ would indicate a ‘do nothing’ signal. Below is a chart that shows the result of my efforts:
Hybrid model (1)
On the chart above, we see the price predictions on the blue/black candlestick graph. The purple line is the result of my signal-prediction ‘thing’ as just explained. I have taught the system that a ‘sell’ signal equals the value of 100 ; a buy equals 50 and ‘do nothing’ equals to zero. In the end the system does not fully respect my values, so it generates something either close to zero, around 50 or close to 100. But it does have some interesting results. If you look closely, it does indicate some interesting ‘buy’ signals (= value 50), and then you have to make a guess for which near-future interval the ‘sell’ signal corresponds with some ‘buy’ signal. In the end this may prove a useful trading strategy, but it’s really hard to interpret and understand as is. I need to do a lot more research and development to improve it.Q-learning
This is a form of reinforcement learning (RL), a technique for training A.I. to do certain stuff. RL is the trick behind teaching a machine how to play chess, Go and even Space Invaders.
RL trained-A.I. playing ‘Breakout’
If we can teach a machine how to play Pac Man, then we might as well teach it to generate buy/sell signals. This is exactly what I did. The logic behind it is to give the system a reward (like a pat on the back) when it makes a good decisions, and if not we punish it. The reward/punishment is expressed as a number, and so we train the system to optimize itself for obtaining the highest possible score. At start it makes a bunch of random guesses, gets its reward/punishment and then learns/re-trains itself based on these results. This process continues indefinitely, until we tell it to stop. We don’t want the system to be over-fitted with respect to the input data, but we also don’t want it to be super random — so we have to make it stop after a certain amount of iterations.The implementation of Q-learning was done by using an open-source project. I only had to tweak & adjust it according to my needs. I also realized that the backbone of Q-learning systems was usually based on a feed forward neural network, I haven’t stumbled upon any solution that used a recurrent neural network instead (yet). But this is what I did implement. I quickly learned that training a system through RL is a very tedious and long process, it takes literally hours/days to complete, depending on the number of iterations and some other factors.
After many painful hours of training I did see some nice buy/sell signals appear, however to me they were more like random than intelligent. Overall Q-learning did not prove to be a successful technique, but I am going to improve it because I believe it’s a gold nugget.
Thank you for reading and stay tuned for the next episode!
- Ilya

waterworks
Senior Member
- Sep 28, 2013
- 1,018
- 383
Haha love the breakout reference. Good stuff Ilya. Looks like you're on the fast track for something big. Congrats.
D
Deleted member 46019
Guest
When i see some one talking about market and macd i know one knows nothing about TA, macd/ma/rsi is the most misleading indicators of all times, it's like looking into moon phases and trade on them, they are made like 50 yrs ago when computer was only a paper and pen. Same for ML it shows super hyper results on backtest but miserably fails on live data. Although Math can be very powerful in trading, but you need to dig way deeper.
healzer
Elite Member
- Jun 26, 2011
- 2,974
- 3,063
Thanks for the input, but instead of breaking down on these indicators, why don't you provide us with some knowledge and guide us in a better direction?When i see some one talking about market and macd i know one knows nothing about TA, macd/ma/rsi is the most misleading indicators of all times, it's like looking into moon phases and trade on them, they are made like 50 yrs ago when computer was only a paper and pen. Same for ML it shows super hyper results on backtest but miserably fails on live data. Although Math can be very powerful in trading, but not with this Mesopotamian approach with macd and rsi.
There is a reason why these indicators are still being used to this day, even in big investment firms.
Thanks
Merlina Staling
BANNED
- Mar 21, 2018
- 12
- 1
I had a recent argument or more of a discussion with a friend over the recent move by Twitter to ban cryptocurrency ad. I think this move is great because of late I have seen a lot of people fall for flashy ICO ads with shallow promises. While my friend thinks that these moves by Twitter, Facebook and Google will hamper the growth of cryptocurrencies but I personally think such moves will help the genuine folks in stealth building of their projects and since these projects add value, I am sure, they will eventually see the light of the day. What do you guys think?
healzer
Elite Member
- Jun 26, 2011
- 2,974
- 3,063
These bans are definitely a good thing for people (such as us) who are building something of value.I had a recent argument or more of a discussion with a friend over the recent move by Twitter to ban cryptocurrency ad. I think this move is great because of late I have seen a lot of people fall for flashy ICO ads with shallow promises. While my friend thinks that these moves by Twitter, Facebook and Google will hamper the growth of cryptocurrencies but I personally think such moves will help the genuine folks in stealth building of their projects and since these projects add value, I am sure, they will eventually see the light of the day. What do you guys think?
Once the shady ICOs are dead & gone more people will start trusting crypto investing, the future looks bright
waterworks
Senior Member
- Sep 28, 2013
- 1,018
- 383
I also believe the future looks bright. I look at these bans like doing a deep clean on the house. The cleaning has only begun and hopefully it continues to wreck these crapcoin projects. Exciting times.
D
Deleted member 46019
Guest
Quant trading bro, put ἄλφα into a black box and you may get somewhere, machine learning and neural networks will start to make sense too.Thanks for the input, but instead of breaking down on these indicators, why don't you provide us with some knowledge and guide us in a better direction?
There is a reason why these indicators are still being used to this day, even in big investment firms.
Thanks
healzer
Elite Member
- Jun 26, 2011
- 2,974
- 3,063
Just swinging some fancy word like "quant trading" helps nobody, honestly. But thanks anyways.Quant trading bro, put ἄλφα into a black box and you may get somewhere, machine learning and neural networks will start to make sense too.
healzer
Elite Member
- Jun 26, 2011
- 2,974
- 3,063
Today's update
- I have added a bunch of Telegram channels to gather more real-time data from. This data can then be used for sentiment analysis and making better predictions.
- About a week ago we started working on a brand new app that will work on all mobile devices (including desktop), so you won't have to install it through an app store any more. We expect to release it in a couple of weeks, so stay tuned.

- Dec 3, 2015
- 5,309
- 6,018
@healzer, I will like pick your brain on data science A.I related projects. I'm not a newbie but far far behind what knowledge you've acquired. I'll like recommendations from you on how best I could scale my game up and set things to work pretty good... Sharing with your sources of learning would as well be appreciated.
Regards.
Regards.