Binary options group

Description : PATTERNS
Candlestick patterns - Bullish Only

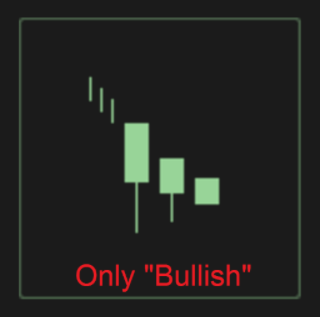
>> "ThreeStarsInTheSouth"


Three Stars In The South is a bullish trend reversal candlestick pattern consisting of three candles.

The Three Stars In The South candlestick pattern is recognized if:

> The first candle is long and bearish and continues the downtrend;
> The first candle has a long lower shadow and no upper shadow;
> The second candle is similar to the first one, but smaller, its Low price is greater than that of the first candle;
> The third cadle is small and bearish, misses shadows and closes inside the second candle's range.

Example :
 
Description : PATTERNS
Candlestick patterns - Bullish Only

>> "ThreeWhiteSoldiers"


Three White Soldiers is a bullish trend reversal candlestick pattern consisting of three candles.

The Three White Soldiers candlestick pattern is recognized if:

> Appearing after the downtrend, all the three candles are long and bullish;
> Each candle's Open price is within the previous candle's body;
> Each candle's Close price is higher than that of the previous candle.

Example :

 
Description : PATTERNS
Candlestick patterns - Bullish Only

>> "UniqueThreeRiverBottom"


Unique Three River Bottom is a bullish trend reversal candlestick pattern consisting of three candles.

The Unique Three River Bottom candlestick pattern is recognized if:

> The first candle is long and bearish and continues the downtrend;
> The second candle is bearish, has a long lower shadow and its body is completely inside the previous candle's body;
> The second candle's Low price is less than that of the first candle;
> The third candle is small and bullish, its Close price is lower than that of the second candle.

Example :

 
Description : PATTERNS
Candlestick patterns - Bullish Only

>> "UpsideGapThreeMethods"


Upside Gap Three Methods is a bullish trend continuation candlestick pattern consisting of three candles.

The Upside Gap Three Methods candlestick pattern is recognized if:

> The first and the second candles are long and bullish and continue the uptrend;
> The second candle gaps up from the first one;
> The third candle is bearish and its body covers the gap between the two previous candles.

Example :

 
Description : PATTERNS
Candlestick patterns - Bullish Only

>> "UpsideTasukiGap"


Upside Tasuki Gap is a bullish trend continuation candlestick pattern consisting of three candles.

The Upside Tasuki Gap candlestick pattern is recognized if:

> The first two candles are bullish and continue the uptrend;
> The second candle gaps up from the first one;
> The third candle is bearish and opens within the previous candle's body;
> The third candle's Close price is within the gap between the first and the second candles.

Example :

 
This might be old but the OP and I have started a Telegram Group to help people get into trading, learn and send som interesting signals to make some proffit.

If you are interested dont hesitate on contacting me or just Download Telegram App and enter the Group -> http://bit.ly/2cDI2m8

See you there!
 
This might be old but the OP and I have started a Telegram Group to help people get into trading, learn and send som interesting signals to make some proffit.

If you are interested dont hesitate on contacting me or just Download Telegram App and enter the Group ->

See you there!
Hi there! i was looking for a group to join on binary options trading for a while. Found your link, but was unable to join. Is the group still active? Or moved somewhere? if so, could you let me know? thanks!
 
Hi there! i was looking for a group to join on binary options trading for a while. Found your link, but was unable to join. Is the group still active? Or moved somewhere? if so, could you let me know? thanks!
Hello.
Yes is still on :)
 
Please tell me are this indicators enough to gave 80% of success???

HqiXCt5


Those are indicators for BTC at the moment. I founded this at investing.com. I had little success on TIQL.CO
Please help :)
 
Hello Iovica.

I would advice you to test them for a period of time, do some more demo trading, and then you can make the percentage. (it will depend on market conditions and news)
After the test period is finished, draw the line and do the math, and you will see if the indicators return 80% success rate, easy as that :) (indicators alone usually are not enugh, add a bit of manual chart reading, price action, market levels and the rate of your winning trades will increase)
You can post the results here, we would like to know how it went :)

Untill then, push hard to achieve the results you want!
 
Those technical analysis at investing.com does not mean anything. I mean you can not predict anything with that. There is something like 50-60% of success rate so that success rate you can have just guessing in which direction price will go :)

Very sad story. I loosed about 400$
 
Those technical analysis at investing.com does not mean anything. I mean you can not predict anything with that. There is something like 50-60% of success rate so that success rate you can have just guessing in which direction price will go :)

Very sad story. I loosed about 400$

I see.

The technical analys posted on these sites is purely informative,statistical, based on past forecasts (most of the time).
You need more than that to rise the % of your winnings, like some chart analys with suport and ressistance lines, some indicators.
Trading depends on many many factors, and there are a lot of traders involved :)

Also you must make a strategy of your own, understand it and then test it untill you are satisified with the results. :)
 
Hello guys, Im new here was was trying to join the BinaryAdrian Skype group but can't find it. Can anyone tell me how ro access it. Any help would be greatly appreciated.
Cheers
 
Hello guys, Im new here was was trying to join the BinaryAdrian Skype group but can't find it. Can anyone tell me how ro access it. Any help would be greatly appreciated.
Cheers

Hello :)
Add the id : binaryadrian , and I will add you manually. :)
 
Back
Top