Cryptocurrency analysis and predictions using AI and big data

Looks like you don't receive the notifications on Bluestacks, damn. I'll have to boot up an old phone of mine.
I was thinking of creating browser-based push notifications.
Most recent browsers (Chrome, Firefox), have this ability to let websites notify users.
Would this be a possible solution for you? :)
 
I was thinking of creating browser-based push notifications.
Most recent browsers (Chrome, Firefox), have this ability to let websites notify users.
Would this be a possible solution for you? :)

Ever since I rebooted the app I get notifications that say "The price is rapidly increasing/decreasing" but none of the others. It seems that some of them work with Bluestacks not just all.

A browser extension would work well yes.
 
Ever since I rebooted the app I get notifications that say "The price is rapidly increasing/decreasing" but none of the others. It seems that some of them work with Bluestacks not just all.

A browser extension would work well yes.
Try going into the settings menu and disable and re-enable the refresh 10min predictions (it's the first switch).
That should re-subscribe your app to the prediction notifications, and you should be then receiving them every 10 minutes.
Let me know if this helps :)
I'll also look into a browser extension.
 
Are there plans for other crypto's not just BTC? If so, any timescales in mind?
 
Are there plans for other crypto's not just BTC? If so, any timescales in mind?
Hey :)
Yes definitely, we currently already have over 17 other cryptocurrencies on our desktop platform.
However, the predictions and anomaly detection is only available for BTC right now.
I am currently working on making all other coins available this week.
Cheers!
 
Hey :)
Yes definitely, we currently already have over 17 other cryptocurrencies on our desktop platform.
However, the predictions and anomaly detection is only available for BTC right now.
I am currently working on making all other coins available this week.
Cheers!

Superb, looking forward to playing with this on both desktop and AD/predictions.
 
Hey :)
Yes definitely, we currently already have over 17 other cryptocurrencies on our desktop platform.
However, the predictions and anomaly detection is only available for BTC right now.
I am currently working on making all other coins available this week.
Cheers!
Awesome job dude!
Just short or long bitcoin with and its really good money.
 
Hi, this is by far one of the best threads here on BHW, so thank you for all your work.

I'm just curious in regards to how accurate the predictions have been, has there been any back testing on historical data or something of the like? I understand you've tried trading with the predictions and have gotten a mixture of profit/losses.
 
Hi, this is by far one of the best threads here on BHW, so thank you for all your work.

I'm just curious in regards to how accurate the predictions have been, has there been any back testing on historical data or something of the like? I understand you've tried trading with the predictions and have gotten a mixture of profit/losses.
Hey :)
Thank you for the kind words.
I have definitely been doing a lot of backtesting and the like.
If you skim over all my posts you'll find a ton of these results -- or even better, as I've just finished writing my latest report (below).
Cheers!

====================
=== March 4th, 2018 ===

Today was a day of reading and learning about AI.
But I've also spent an hour or two on cleaning up code, optimizing scripts and running some backtests.
In this post I would like to discuss and illustrate what we have accomplished thus far, and what we can do with what we have.
If you've been following our progress since the beginning, you just can skip to part 2 of the article. :)

Part 1 -- an overview

Gathering Data and manual analysis
So until now we have been gathering data related to cryptocurrencies.
The data we gather is primarily an aggregation of the price, trading volume, social mentions (e.g. tweets, mentions and posts) and news articles (from major news channels).
On our "general chart" (and the 3D charts), you are able to look at this data for almost 20 different crypto coins.
In the first several weeks since I started this project, we exclusively used the charts to make conclusions and answer questions like why the price of Bitcoin went up or down during a certain period in time. The idea is to find trends in these charts that could indicate why such an event occurred. By doing so, we can to a large extend, make predictions of what will happen in the near-future (e.g. in the next 1 hour) by looking at the current state of news articles and social mentions.

Since most of us (including me) try to have a social life, we shouldn't do this manually by hand, but instead utilize systems and algorithms to do the analysis and trend detection part. This is what "big data" and "machine learning" are all about.

From Data to Machine Learning
For those who've closely been following my progress -- at some point I started building Neural Network models. Neural Networks are like artificially created brains that can learn stuff. The things they learn is what we feed into them -- so if we feed them data and teach them that Y=4 for x=2 , and Y=6 for x=3 and that Y=16 for x=8, ... doing this a few hundred/thousand times, then the system will be able to reproduce the function as in our example is: Y(x) = 2*x . This means that given some input number "x", it will be able to predict/compute the output "Y" -- which in our case is just the multiplication of "x" and 2. Neural Networks are nothing new, they've been around for half a century -- but their usage only became very popular in recent years due to more cheaper memory and more cheaper processing power.

As in our case, we used special types of neural networks to be trained using our data. And we train it to predict the price of a crypto coin (e.g. Bitcoin -- BTC).
I've spent quite a lot of time (and still am), figuring out which combinations of data yield the best results. And another challenge is tweaking the parameters of a neural network and it's learning components. However, I am truly fascinated by the world of AI, as many people are, because these systems are "trained" -- they are not programmed like a regular piece of software with code. They are like artificial brains that can take input and yield a meaningful output -- but we don't always fully understand what's going on inside that black box. However, they are also very limited and narrow, meaning they are only trained to do a specific type of job (e.g. making a prediction within a very narrow space ; or playing chess or playing Go). Although this isn't part of my research/project, what researchers are doing right now is teaching such a system how to drive a car, just like an ordinary human would do -- so it easily becomes a very complex task but worthwhile pursuing.

Back to our project -- it has been more than a month since I first started making price predictions using Neural Networks. And the results are really good, but not great. I have posted a lot about this including the results, so if you want to learn more (after reading this post), skim through my previous posts.

Detecting Anomalies
As I've been trading on my favorite exchange -- I noticed that it would be super useful if I had a system that could notify me when the price was increasing (or decreasing) rapidly in a very short amount of time. Because most day traders like to enter and exit trades within a few minutes (or a few hours) depending on the currencies they are trading. But we don't want to sit in front of our exchange window all day long waiting for that golden opportunity.

In doing so traders make anywhere between 0.5% and 3% ROI on a single (or multiple) trade, doing that several times a day (if the market allows us), we can make a nice amount of cash. So long story short, it took me just several hours to build, test and release an Anomaly Detection (AD) system. And in one of my latest posts I've released some ROI results that were really great. But knowing that what I have is still a very basic system, makes me even more happy because by tweaking & improving it it'll only become better.

The mobile App
A few weeks after having started my journey, I've released a beta version of our website. The website was primarily designed for notebooks/desktops, not for mobile devices (such as tablets and smartphones). But I realized it would be even better if I had an App where I could consult my data and look at the predictions -- so after a couple of days I got it done. Right now it supports +70% of all Android devices and you can find by searching for "CryptoPredicted" on the Google Play Store if you'd like to play with it.

Backtesting
Backtesting, in our context, comes from the world of trading. It's a system/method where we use historical data to run trading simulations.
These simulations allow us to evaluate trading decisions made by some indicators, such as Simple Moving Average (SMA) and many other.
In our scenario, we have been making simulations using our prediction results, and since recently also using the Anomaly Detection (AD) system.
So feel free to re-visit some of my older posts if you want to read about the backtesting results.

Part 2 -- A.D. versus A.I.

Back to backtesting -- as I mentioned in the intro I've spent some time today doing more simulations. And if you recall, in the past I've mentioned that backtesting results are highly dependent on the state of the market. So if the market is crashing the results would most likely be break-even or negative. While in a growing market it's hard not to make a profit. :D

If you've read my previous backtesting experiments, using solely A.D. then you've seen that we had some great returns from it (such as 17% over 7 days). While in the case of our A.I. generated predictions, the results were highly dependent on the state of the market. So I was wondering, how would A.D.'s system work in a declining market?

So in this example we shall be simulation trades, solely based on one of our indicators. First off, let's start with a situation where the market started to crash/decline at some point. Let us look at February 25 (2018) on the chart below; where at 6:30am (UTC) the price of BTC dropped from $10.4k to just above $9.4k at 22:00 (10pm):

0oUrrTl


Let us backtest/simulate trading during this day (full 24 hour range) and see how much ROI we would make/lose.

A.I. generated predictions
I have used two trading strategies "FirstPredic" and "MinMax":
  1. FirstPredic: The first one only uses the first prediction for the next interval (10 minutes in our case) and compares that against the current/actual price. If the prediction of the price (10 minutes into the future) is lower than the actual price we let it generate a "sell signal", and in the other case, if the price is about to go up then we should generate a "buy signal". By doing so we would always buy low and sell high, thus making a profit. Whether we'll make a profit or not depends on the quality of the predictions.
  2. MinMax: The second strategy uses all the predictions -- our system actually generates 8 price predictions into the future (thus 8x10 = 80 minutes ahead). And we then use these to find the lowest (min) prediction and the highest (max) prediction within this 80 minute interval (that's why I called it MinMax). We then generate a "buy signal" for the lowest point and a "sell" for the highest point. Once again, this will make a profit it the actual price follows the predicted values.
Here are the trading (ROI %) results for MinMax:

LPEdX8o


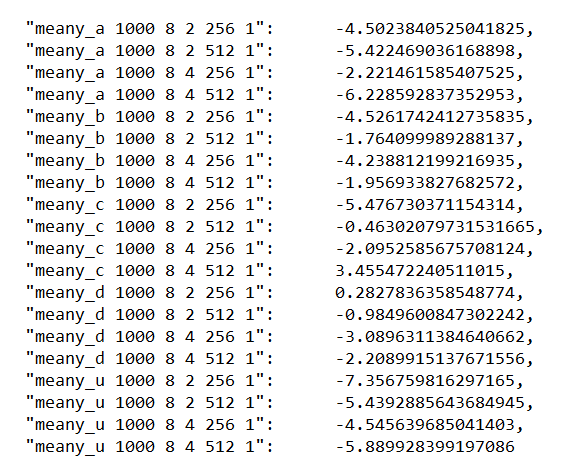
Overall the results are negative, and the system makes a loss on average (of between -0.5% and 8%).
Notice that there are multiple lines, each line represents one type of prediction -- this is because we have multiple different Neural Networks that generate a different output. This allows us to evaluate and score which one is better than the other.

And here is the one for FirstPredic:

wMM8hW5


Once again, most values are negative thus the system makes a loss on average (of between -0.5% and -4%).

A.D. generated signals

In one of my previous posts I discussed how to use A.D. as trading signals, so make sure to check that out because I'm not going to discuss it in a lot of detail here.
But the basic concept is to wait for the AD system to generate a notification that the price is going "up", and then wait until the price stabilizes (when the market reaches a plateau). Once it reaches that point we then generate a "sell" signal, because that's a point where the price has reached a new local maximum. And the reverse is also true, when there is a notification that the price is rapidly declining, we wait until it has reached some new stable position where the price is pretty low -- at that point we generate a "buy" signal.

The end result is that it would be buying low and selling high. The results also speak for themselves. As shown below, this system has made 5.36% ROI (that's pure profit) in a declining market. And so A.D. appears to have easily beaten our A.I. system.

VIluAfw


Now let us look at a period when the market started to grow. I have chosen February 26th (the whole 24 hour range as shown below) -- it's an interesting range because nothing extraordinary happens during the first 14 hours, but then at about 2pm the price shoots up rapidly and reaches a new plateau.

LMlCBti


Let us look at what the A.I. predictions give us.
The MinMax strategy yields us these ROIs:

nmcQSzn


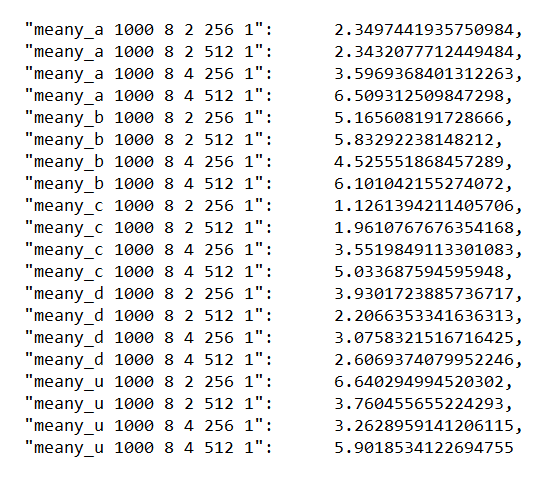
Overall they are quite positive, on average between 1% and 6% -- so not bad at all.

Finally comes the FirstPredic strategy:

pHeR8k2


Once again, quite similar results with ROIs between 1% and 6%.

It shouldn't surprise us by now that A.D. system beats the A.I. system once again, with an 8% return:

j7iea33


Discussing our findings
Does this mean that A.I. is irrelevant because it yields worse results than A.D. ? Not at all.
In my opinion what we have achieved from the A.I. is already remarkable, and if we keep investing in it and learning how to optimize it, it might break-even with the A.D. system.
Hypothetically the AI could perform even better than AD if it could be trained to detect and predict peaks/valleys pretty accurately.

I also think that our two current backtesting strategies are not optimal (MinMax and FirstPredic). It could be that the AI generated predictions are trying to tell us something meaningful in some way, but that I have the wrong system in place for interpreting its outputs.

I have many ideas for the AI system and how to improve it, one that I'm very excited about and willing to share in public is a system that learns to trade and make the pseudo-best possible decisions. This would be a much better system than one that merely makes price predictions.

But in the short-term, it's way more realistic to shift our focus to A.D. systems -- because the crypto market is highly volatile and anything can happen in matter of seconds. We can never predict if/when some whale will use a large amount of coins to push the market in some direction. So it is actually these scenarios we need to anticipate using A.D., because they are un-predictable.

I hope you've enjoyed and have a great day! :)
- Ilya
 
Where can you find the buy/sell signal on the graph?

Thanks.
Hey :)

The buy/sell signals are only available on the desktop-version website (see screenshot below).
These are super basic/dumb signals, so I do not advise you to use them for serious decision making.
The buy signal is solely the lowest predicted value on the avg-line, while the sell is the highest predicted value on the avg-line.
kjesa9J


Right now I would advise you to use our Anomaly Detection notifications as buy/sell signals -- as I've explained in this post: https://www.blackhatworld.com/seo/c...-ai-and-big-data.998766/page-13#post-10848584
Hope this helps :)

====================
=== March 5th, 2018 ===

Yesterday, late into the night, while lying in bed I was doing my favorite ritual: data analysis.
I was going through recent events on the general chart, looking for interesting things.
Here's a short summary of what I've found.

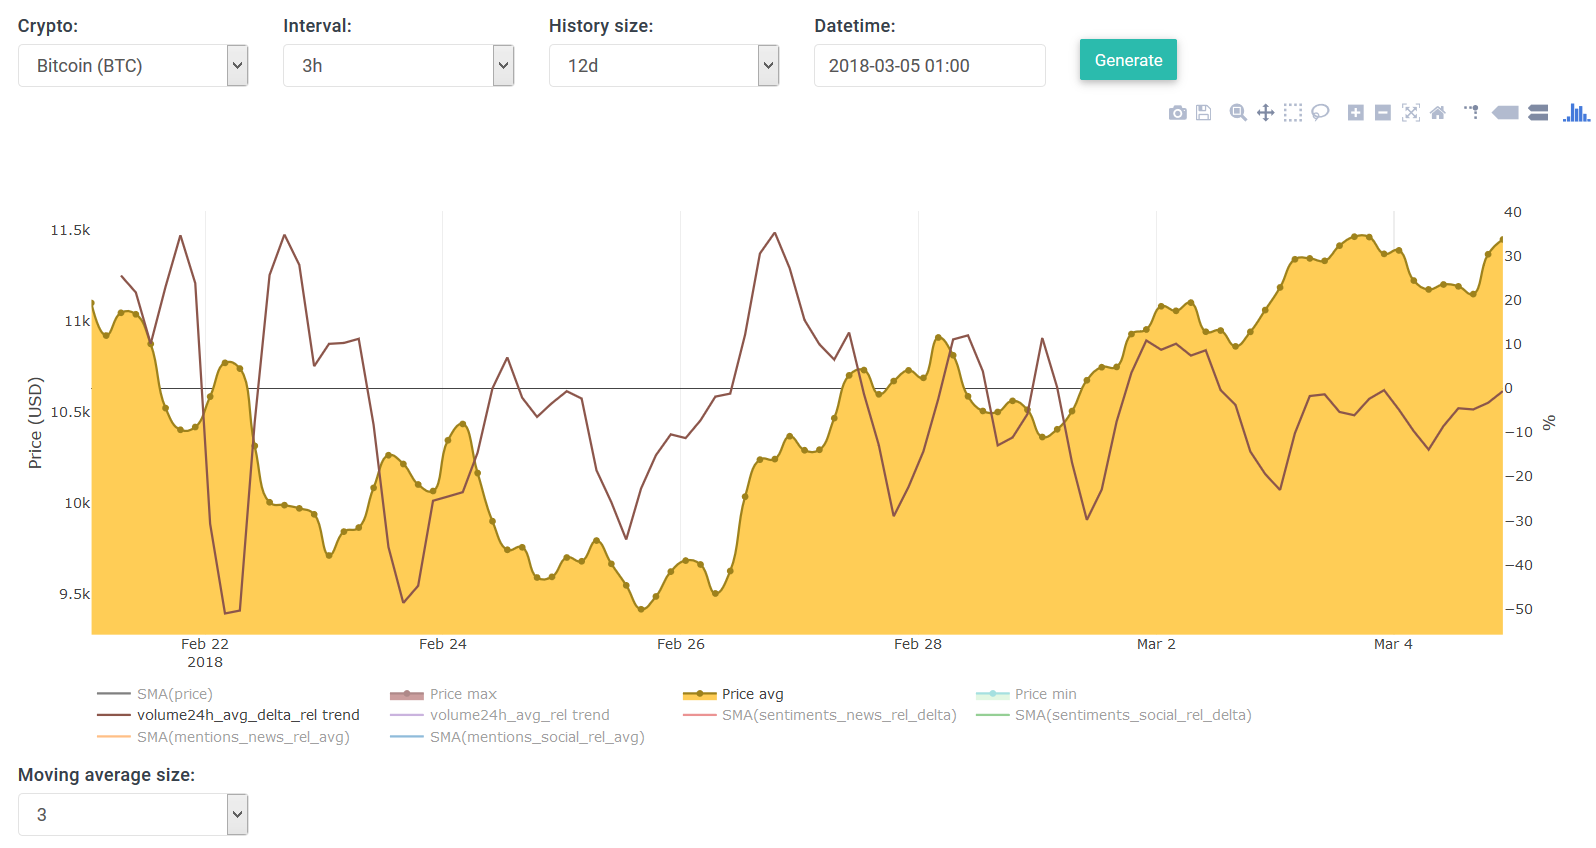
Below is a screenshot of BTC's price (orange area) of 12 days since March 5th (00:00 UTC) -- each interval consists of 3-hours worth of data (aggregated).
The dark red line is the (delta) trading volume. What we notice is that the trading volume has these aggressive peaks and valleys (where its value drops/grows rapidly). But It looks somewhat cyclic, meaning there is some repeating pattern in there but it's very raw (due to the large 3h interval). This does not tell us much, but ...

hac8pOG


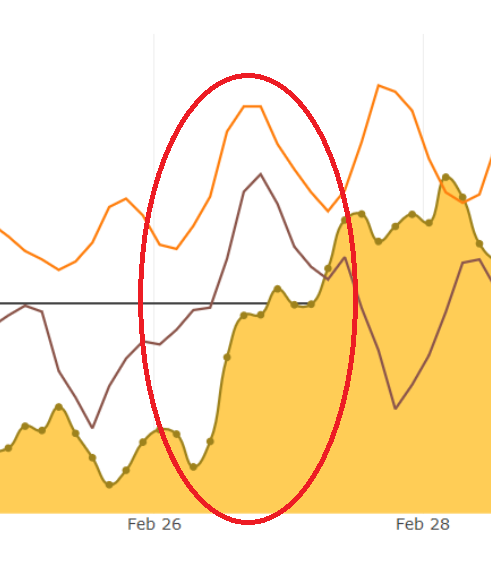
Now, let me add another dataset to the chart: a "flashy orange line", which represents the news mentions. A news mention is an article published on some major channel (e.g. CNN, CNBC, BBC, ...) and talks about the selected cryptocurrency (Bitcoun in our case). What's remarkable is that this line also appears to be cyclic, it has similar aggressive peaks/valleys. But what's even cooler is that a peak in trading volume matches a valley in the news mentions -- and vice versa as well.

UMBWUKI


This is appears to be true for a majority of the peaks/valleys on this chart, with a few exceptions, such as the two large peaks just a few hours after "Feb 26" (see next image). Since we also have SMA size set to 3 -- it means that these two lines/graphs are "lagging" by 3 hours compared to the price --- now look at what happened to the price 3 hours prior to these matching peaks, it went up quite rapidly. It could be that the market was pushed/influenced, as a result the price went up quite a lot. Maybe in the future, once we have more data, we could have a better version of what happened here -- and we also might use these findings to make better predictions.

56a7Ufj


On the next screenshot I've also added the social mentions (blue graph). These are the number of social mentions related to Bitcoin (BTC). What's interesting here is that it's cyclic as well and to some degree in-phase with the news sentiments graph.

xVArtTB


Here's something else, on the screenshot below I've set the history size to 20 days (instead of 12) -- everything else is the same. But now I've shown another graph, namely "news sentiments". News sentiments are the results obtained from our sentiment analysis system, which analyses news articles to determine whether they are positive/negative. I haven't noticed this before, and it's not easy to see it on first sight, but it seems like these sentiments "predict" the future price:

VNavYx0


It's not easy to see what I mean in its original form, so let me break it up into pieces using Photoshop:

Y37ZOdx


By slicing up the red graph (the sentiments data), and by shifting it by several days, we see how the red line matches "some" regions of the price's data. This is a nice find, but probably completely useless. We shifted the sentiment graph by more than 3 days, so in essence this line makes predictions 3 days into the future. I haven't calculated the accuracy of this since we don't have enough data to verify this find. But I wouldn't rely on this too much -- yet it's still a cool find :D

Once I was done with Bitcoin, I also had a look at some of our other altcoins.
In the case of "DASH", I noticed that social mentions (and social sentiments) graphs appear to follow the price, and to some degree predicting it:

MC20b6B


Litecoin is also highly influenced by social media as seen here:

VvXR0ia


For most coins I've noticed that trading volume was of less importance as a prediction indicator. Meaning, social mentions data appears to be a good and better predictor. Finally I went to sleep.

App version 1.0.1.0
After having woken up, I started working on on our app and made some pretty big changes.
Here's a summary:
  • New settings layout.
  • AD: different levels (+disable option).
  • Predictions: different frequencies (+disable option).
  • New version update notifier.
  • Bugfix: missing notifications.
New settings layout:
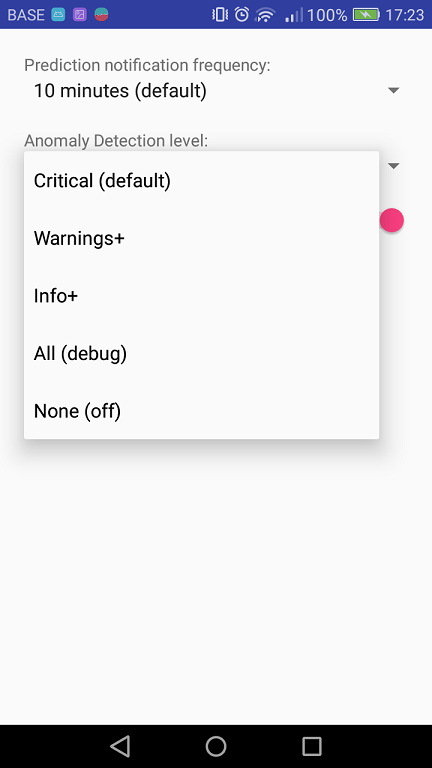
The layout changes and most of the switches are replaced by a drop down lists.

AED0te2
xIOFVnI
kCiMWa4


Prediction notification frequency
The first one is prediction frequency, here you can select which type of prediction notifications you would like to receive: 10min or the 60min (hourly) predictions.
On the Forecast screen, on the app, you can always view both type of predictions by changing the interval -- this frequency setting only affects the push notification.
You may also disable this if you don't want to receive any update/notification when a new prediction is generated.

The text/message of these notifications has also been changed, below is an example of new version.
The algorithm that makes up the message solely uses the average line (the middle prediction) -- it does not generate a message by using two of the extremes (the max or min lines). So in this example, the first predicted value (of the avg. line) is higher than the current/actual price, that's why the message states that the price might increase within the next interval.

bp2Q6vv


Anomaly detection level
Now we can choose which level of notifications we want to receive.
  • Critical (default): this will only notify you of the most critical events, e.g.:

    ySZEiDr


  • Warnings+: this notifies us of quite important events, including critical ones:

    cJ0guBj


  • Info+: this notifies us of Warnings, Criticals and less important events:

    uahou45


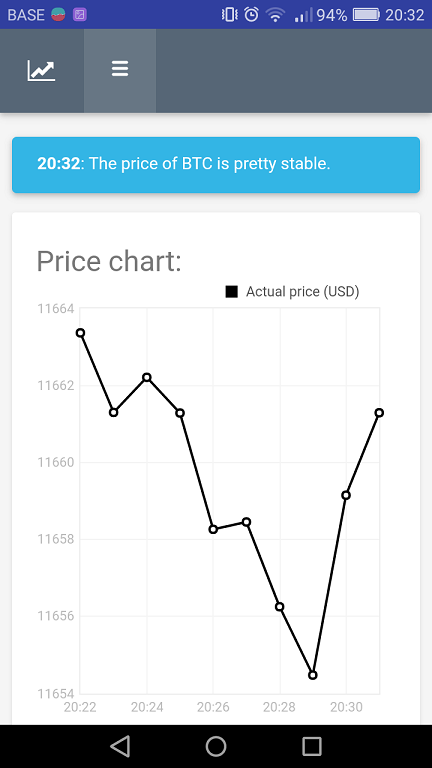
  • All (debug): this will notify us on every one the above events, even when there is nothing going on. The lowest level is called "stability", i.e. when the price is quite stable:

    8B7Swjb
You may notice that what the system considers as "critical" or "stable" is not necessarily a critical or stable event for you and me. So in the near future I will definitely be tweaking the system and make it more customizable.

New version notifier
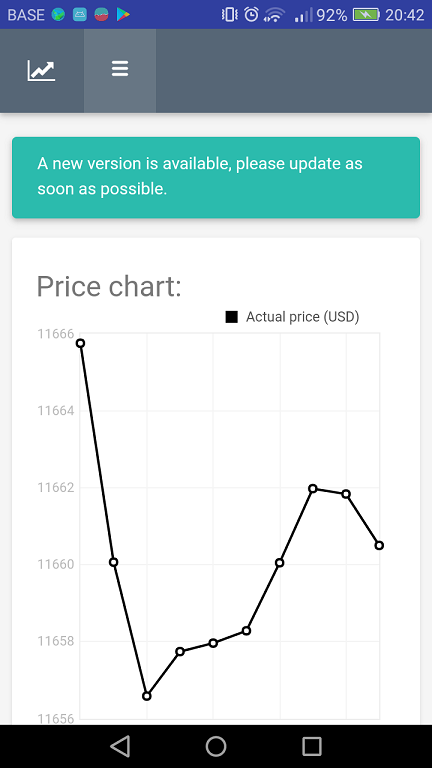
As of now on, a notification label will appear when a new version has become available.
I believe this is necessary to let people know to update as soon as possible. Because when another big change happens, old components (on previous versions) may no longer work correctly.

0NC3Wel


Thanks for reading and have a great day! :)
- Ilya
 
I've just started reading through this thread and it is fantastic! Still gotta read some more.
Just wondering what the desktop version is or url name? Got the app now on my old android phone which is a bit slow. But i like it.
 
Your methodology is interesting.

I teamed with some quants, formerly from big I-banks, to develop an AI that includes hundreds of Alt coins as well. It looks like we're taking different enough approaches that talking privately might sense since I don't think we'll be stepping on each other's toes.

PM me if you're interested.
 
I've just started reading through this thread and it is fantastic! Still gotta read some more.
Just wondering what the desktop version is or url name? Got the app now on my old android phone which is a bit slow. But i like it.
Thanks for the kind words :)
You can access the desktop version here: http://cryptopredicted.com/
Would love to hear more feedback from you in the future.
 
==================
=== March 7, 2018 ===

Today I have dug out some pretty golden information :)
Don't share this post anywhere outside BHW forum, or else.

I was playing around with the price and volume data from our database. And I wanted to plot out different data for each hour within a day. Concretely I wanted to see if there was some kind of pattern within a single day.

So what I did was pull all price and volume data, at 2 min intervals, for the past 14 days. This means data from Feb 13 (included) until Feb 27 (excluded), just for Bitcoin - I haven't done other coins yet. And remember that we have two types of volume: trading volume24h and volume delta (which is calculated by: volume24(t)-volume24(t-1) ).

One more thing, I want to make a plot by the hour, but since we have 2min intervals, we need to calculate the average of all data points for their given hour. The end result looks like this:

yJ3Sb8W


On the left we have a table, where I've inserted the normalized averages, such that they are within the range [0,1]. By normalizing the data we can easily compare their trend/behavior (e.g. compare price and volume). Notice: our date and time corresponds to the UTC (GMT) timezone, so same is true for the "hour" field.

On the right I've drawn radar chart for our three (normalized) datasets. Orange is price (in USD $), blue is the trading volume24h and green is the volume delta.

Notice that the radius on the radar goes from [ 0 at the center -- to --> 1 the outer circle ]. This corresponds to our [0,1] of normalized data. Where 0 corresponds to the smallest value, and 1 to the largest one.

By looking at the three graphs, I noticed that there seems to be no relationship between price and volume delta. So let's remove that one for now:

bwb0ZEm


When comparing the price and volume24 we do see some interesting (and pretty obvious) things:
  • When the price is very low (=0.1 at midnight) then the trading volume24h is at its highest peak (=1).
  • When the price is at its lowest (=0 at 10:00) then the trading volume is quite low as well (between 0.4 and 0.5).
  • When the price is at its highest (=1 at 23:00) then the trading volume is pretty high but not highest (=0.8).
These are interesting facts from the observation, but they don't help us much. So the next thing was to look at the times/hours themselves:

MYnm8op

  • The price is highest at 23:00
  • The price is lowest at 10:00
  • The price is very low at 00:00 (midnight)
This got me quite excited, because I can use these finds to create a super simple/dumb trading strategy. The strategy is as follows:
  • Buy when the price is lowest (at 10:00)
  • Sell when the price is highest (at 23:00)
A few minutes later I added a new backtesting strategy and started running tests. The first ROI result I obtained was similar to the one you can obtain from the graph above. However, our backtesting system enters a buy/sell trade for 100%, so it uses all its resources for the buy/sell trade. So in our case, if it enters a buy it will do so when the click strikes 10:00, and then it won't do anything until 23:00 to sell.

A few more things before I post the results:
  1. The charts above were generated from data within a specific date range (13Feb until 27Feb), so they are only true for this respective range. But I wanted to see how this trading strategy would perform outside this range as well.
  2. Since our system enters using 100% of the resources in a single shot, we need to create two experiments: one where it enters a trade at its lowest point, and another one where it enters at the 2nd lowest point (at midnight that is).
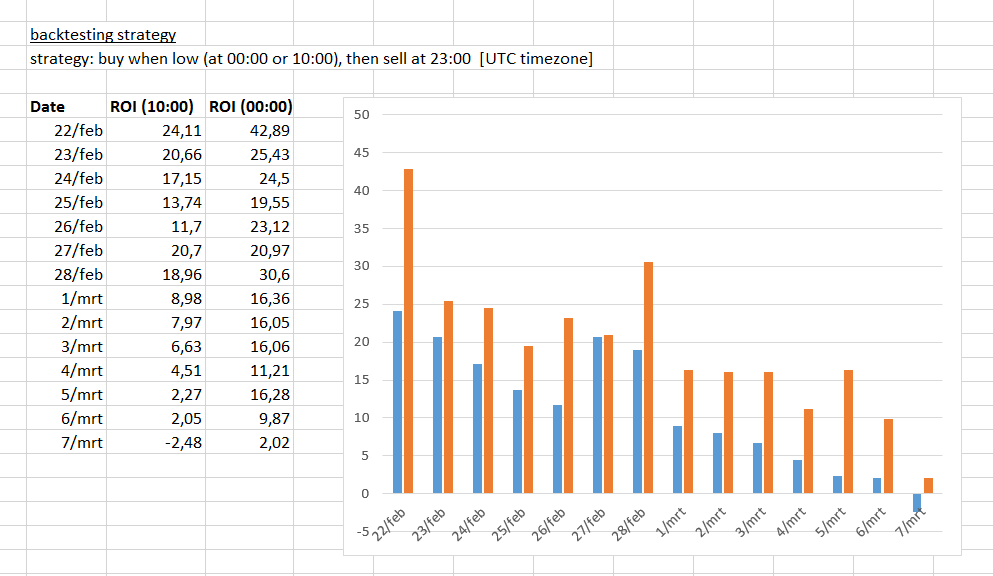
This is what I've obtained from the backtests:

0IS5lNF


The first data column is "Date". This indicates until which day (excluded) the backtesting was done. Each backtest spans over 14 days and ends in the indicated Date value.
So e.g. 27/feb means from 13 Feb (included) until 27 Feb (excluded) [this is the same range of data as for our previous radar charts].

The second and third columns are the ROIs obtained from the backtesting system. There are two columns, each representing a different experiment, the first one is the one that enters a buy trade at 10:00 (lowest price); the second ROI is from trades entered at midnight (2nd lowest point).

On the right I've drawn a 2D-column chart showing both ROIs. The blue columns are from ROIs entered at 10:00, while the orange ones are from trades entered at midnight. What's interesting is that the ROIs (on average) are higher for trades entered at midnight (which is the 2nd lowest point). This may be true in our case, but it does not mean it's generally true. Remember that our system enters trades at exactly the given time, but it could be that the real maximum value is reached midway at 23:30. To make more precise calculations one would need to include not only the hour of the day, but also the minute of the given hour to obtain a clearer picture.

However, by looking at the ROIs, it's pretty amazing to see such big numbers such as 42%! It's even more mind blowing if we consider the fact that it only does one full trade cycle (buy+sell) per day. So the system only makes 14 buy+sells in total to get those ROIs.

We also see something else on this chart, as time goes by the ROIs decrease. My initial thought was that the price of BTC dropped in March, compared to what it was in February, but that appears to be false:

GDscdGq


We clearly see that the price in March is increasing, except for March 6 where it started dropping again. I don't want to spend too much time figuring out what happened to the ROIs, but here is what I think most likely happened: We are running backtests within a 14day window, and from the ROIs we see that they plunge from March 1 onward. So it's quite likely that the trades between Feb 20 and Feb 26 are having a big impact on the ROIs, because during these periods there was a decline (as shown on the price chart), thus a big chance the ROIs are much lower because of these bad trades.

TL;DR
If you didn't understand a word of what I just wrote, remember this:
Buy Bitcoin either at midnight or 10am (GMT timezone) where it's most likely to be lowest, and then sell it at 11pm where it's most likely to be at its highest peak.


b2PMkX2


Have a great day! :)
- Ilya
 
I'm coding my bot too. This fking awesome topic makes me feel impressive. Keep the good work bro!
 
Now this is the kind of information I want to start my day with! I'm an Economics major with a (long-standing) interest in programming, so I'm curious to learn more about you project.
 
Back
Top