Thanks!
A day ago I made the app compatible with Android version 5.0, but I didn't think people had even older smartphones.
But apparently quite a lot still use Android 4 (or even older), so I'll look into this coming few days and keep you posted when it's released

==================
=== Feb. 27, 2018 ===
Today I didn't do any work on the app, but instead was occupied with backtesting.
I don't think I have published any backtesting results/outputs since our latest version 3 release of the predictions chart.
Let me refresh some memories first and explain things
You may skip the following section to the "TL;DR", but if you are a hardcore trader then keep reading.
In our current backtesting efforts, I am using only the predictions to make trading decisions (buy/sell).
So instead of using industry standard indicators such as SMA/EMA/... to decide when to buy/sell, we use predictions and historical price data.
In my previous posts I have published some nice results and improvements, where an artificial trader named "Maggy" was trading.
To put it in a nutshell: every single interval (thus every 10 minutes) our trader "Maggy" can make a decision to buy/sell.
The only information that Maggy has is shown on the chart below: the historial (known) price, and future predictions at a certain interval:
Basically, I simulate Maggy make decisions for a long range of intervals (e.g. 144 times).
However, Maggy will not necessarily make a buy/sell every at every step.
If I use a range of 144 steps, where each step is a 10-min interval prediction, then we actually simulate Maggy doing "24 hours of non-stop trading every 10 minutes" (144 x 10min = 1440 minutes = 24hrs).
In other words: for 24 hours straight, every 10 minutes, Maggy will use the given data to make a buy/sell (or a "do nothing") decision.
The trading strategy I am using right now is pretty dumb/simple: we let Maggy only use the first prediction and compare it against the previous price.
This can be seen on the screenshot below, where I marked the two values used in this strategy.
However, notice that we have many different predictions at every single interval.
On the screenshot, I only marked the predicted value of one of the predictions, while our simulation takes into account all of the predictions.
We simulate the entire 24-hours for each distinct prediction type -- since each prediction has its own unique name/id (e.g.
meany7,
hopkins, etc.).
So how does the trading strategy work, given these two data points?
It's fairly simple, we let Maggy buy if the prediction price is higher than the actual price, because then she may make a profit.
In the other scenario, if the predicted price is lower than the actual price, then we tell her to sell.
We record these buy/sells for each interval, for the entire range, and then simulate the trades -- so in actuality she can only buy if she has cash ($ USD) and she can only sell if she has Bitcoins (BTC). In this simulation we let her buy/sell by 100% -- so she has to sell/buy everything in one shot (for simplicity reasons).
Now that we have a basic idea of our trading strategy, let us look at the results.
First off, I started the simulation for February 27 (00:00 UTC), for a range of 144 steps, and used the 10min interval predictions.
Thus this simulated Maggy doing trades for 24 hours straight (10 minutes in between each trade).
Maggy starts with $10,000 and has to use the entire sum to buy, and if she has to sell Bitcoins, she sells everything in one shot.
Note: we do not include transaction/trade fees in our calculations.
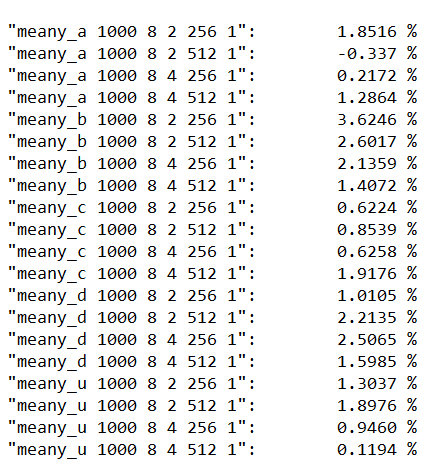
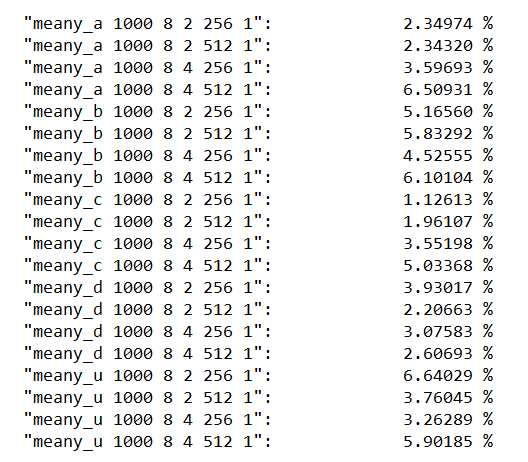
Below is the screenshot of the results.
On the left side we see the names/ids of the used prediction types (they are all unique/distinct, and you don't need to know what the numbers stand for).
Next to each name/id there is a percentage value that indicates the ROI of the simulation for that predictions type.
We see that most ROIs are at least 1%. The average ROI is ±%1.42, so after 144 trades (in 24 hours), Maggy has made ±$142 in profits.
This is great to see, because Maggy is not biased and always buys/sells when our trading strategy tells it to. So this means our strategy is profitable!
But it also means that it can be improved (e.g. making it sell only if there's a positive ROI outcome or the predictions indicate a rapid decline).
However, it's not an easy task to implement these additions into a trading strategy, but not impossible either.
Even though these ROI figures look great, it's because during the day of February 27, the market was pretty positive -- there were no crazy price stunts.
When we run the same simulation, during a less positive period in time we'll see more negative ROIs than positive ones.
This is most likely because the predictions tend to predict an increase after a huge drop, because that's what has happened thus far in the market.
But we'll also see more negative ROIs with less trading steps.
To illustrate this, I have used the same starting point (Feb 27, 00:00) and let it simulate only 6 steps (instead of 144), so 6x10min = 1 hour.
I wanted to see how much profit Maggy would've made if she made only traded for one hour (instead of 24hrs).
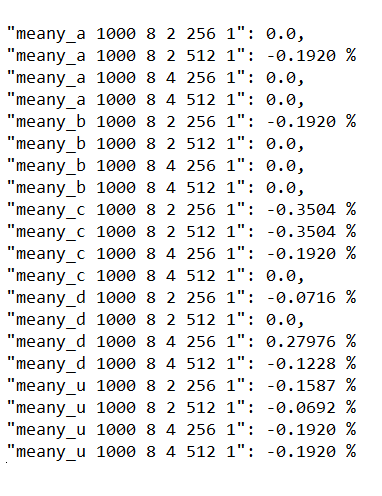
The results aren't spectacular at all:
The lines with a zero (0.0) ROI, indicate that no trades occurred at all.
On average, Maggy made a small loss (her average ROI is less than 0.2%, which is < $20 out of $10k the started with).
So if you are wondering why/how this happened, look at this chart:
Note: The datetime on the screenshot is in GMT+1
The darkest black line is is the actual price (known to Maggy at Feb 27, 00:00 UTC). The slightly brown/red lines are the predictions Maggy uses.The gray line is the extended average price, this is not known by Maggy. But because by now we already know that price "we" can include it and see how the predictions performed versus what happened next. We see that the price started going up until 01:40, and then started going down. We actually only used the region between 01:00 and 02:00 to let Maggy trade.
But remember, every interval, the predictions change because we have a live learning/training AI system.
The reason why in this case Maggy had negative ROI was because of the decisions she made by obeying our trading strategy.
If we want to dig deeper and see which decisions Maggy made, we can, here's an example for one of the prediction types:
On the screenshot above I have indicated (in green rectangles) the decisions that were made during that one hour.
So at 01:00 (GMT+1), Maggy decided had buy because the predicted price indicated $10276.- while the previous price (not shown; at 00:50 GMT+1) was $10307.- ;
In other words, the prediction indicated that the price would go down at 01:00 (GMT+1), so this means it should then enter a buy trade.
And later, at 01:20 (GMT+1) there is a sell indicator because the prediction showed the price would go down compared to the previous price (at 01:10 GMT+1).
In the end Maggy only made two trades. This is also because we remove trades from the end such that the last trade is always a "sell". We want to make sure Maggy exits, so we can calculate the ROI in $ USD.
If you've been following carefully, you will realize that this is a pretty dumb strategy.
Every decision is blindly made, thus solely based on the previous price and the first future prediction -- the strategy does not take into account the price when Maggy has to buy/sell.
In other words, we can greatly improve this strategy by letting Maggy sell only if she would make a profit, otherwise hold - -or make her sell out of fear due to a declining trend.
But the whole concept of this strategy is to calculate/determine the accuracy of the predictions, not to generate the highest profit.
If we improve this strategy as just described, it also becomes more complex to ensure Maggy has a guaranteed exit at the end of our time period. It may happen she doesn't sell the Bitcoins at the very last trade, so we either have to extend our testing range, or let her exit at the latest price (whether that be a positive or negative ROI).
To conclude this topic, below are a few more results from different dates.
Each of these simulations consisted of 144 steps (10min interval predictions) as in our initial example.
Start date: Feb 26, 00:00 UTC
The above looks very promising, these trades yielded at least 2% in most cases.
Start date: Feb 25, 00:00 UTC
This scenario is more mixed and I see more negative ROIs than positive ones.
We conclude that this strategy depends on the state of the market, which is different every single day.
And to increase our chances of having a positive ROI, we need to trade over a long period of time (24hrs wins over just 1hr on average)
Why is all of this useful?
It's useful if you wish to automate trading (trading bots).
Because regular people don't want to spend all their time watching an exchange screen and making a trade every 10 minutes.
Most day traders use notifications or custom indicators to buy/sell, and if you have a large sum of cash (e.g. $20k) then one or two trades a day can suffice to make a decent living.
Just 1% ROI on a $20k trade is already $200, more than enough to get by. But we cannot expect to make at least 1% every single day, some days we might lose up to 5%.
It's a risky and stressful business, and that's why a lot of people tend to use software/bots to automate their trades.
Automated trading can be lucrative, given a good strategy that is.
On the other hand, if you use some crappy indicators/bots, then chances are much higher that you are going to have more miserable results.
TL;DR
All of the above could be too much information too consume.
And as most humans, we prefer simplicity over complexity.
This is where the mobile app makes a huge difference!
All of the above can be summarized like...
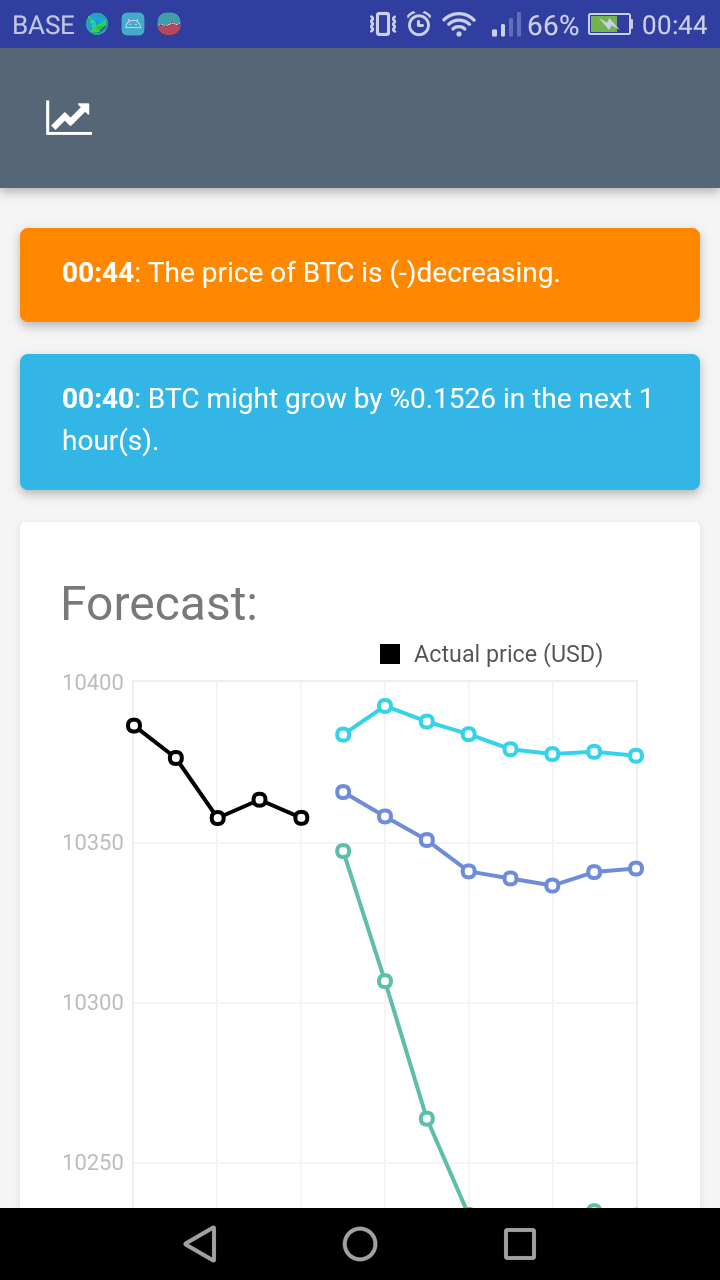
Buy Bitcoins (or some other crypto), when you receive a notification that it might increase in the next 10 minutes like:
and sell when it predicts that the price might drop in the next 10 minutes....
What will happen after +100 trades is that your ROI might be between 0% and 3%, if you trade during a steadily increasing period (if you are lucky that is).
But it's also possible that you may lose between 0.X% and 3%.
However, if you end up selling only if you would make a profit then by default your ROI will be positive.
The tricky part, and the most difficult one in my opinion, is to decide when to sell.
In a declining market (which may not be so easy to detect on sight), we must sell ASAP to minimize our losses.
While in a growing market we may want to hold as long as possible, but without missing the chance of selling to get at least our 1% ROI.
What's next?
Yesterday I added the anomaly detection (AD) system based on the price.
I believe this is a very powerful indicator that can be used to override buy/sell decisions.
When there is an unexpected increase in price, there is a big chance it may grow even higher -- so as soon as we detect such an anomaly we should enter a buy trade.
On the other hand, if we detect a rapid decline, we should sell immediately if we're holding any crypto.
I would like to incorporate this tactic into our trading strategy and/or build a strategy solely using the AD notifications.
Even though these are quite rare events, they should definitely be investigated asap.
I was also thinking of making an open source community for the backtesting part. There is so much that can be achieved and learned by solving this issue as a group, where various users/members can play around with the API and build their own strategies using our available data!
"There is a lot of math to trading, but also some luck.
Nobody knows what tomorrow will bring.
But we can calculate probabilities to minimize risk and maximize ROI."
Have a great day all
- Ilya