We need to talk
@healzer ! Wrote you on skype - fantastic project here!
Thanks for the chat! I appreciate your time

=================
=== Feb 04, 2018 ===
=================
Today I have started working on the backtesting part.
I've noticed a few things that would cause me trouble, such as the delay in generating predictions.
Sometimes it would take up to 30 seconds before I got the prediction results, so I refactored my code and incorporated a caching system for predictions.
I have also removed the "extend actual price" slider -- this means if you look at historical intervals, the actual price will automatically be extended.
You will also see that there is a red "
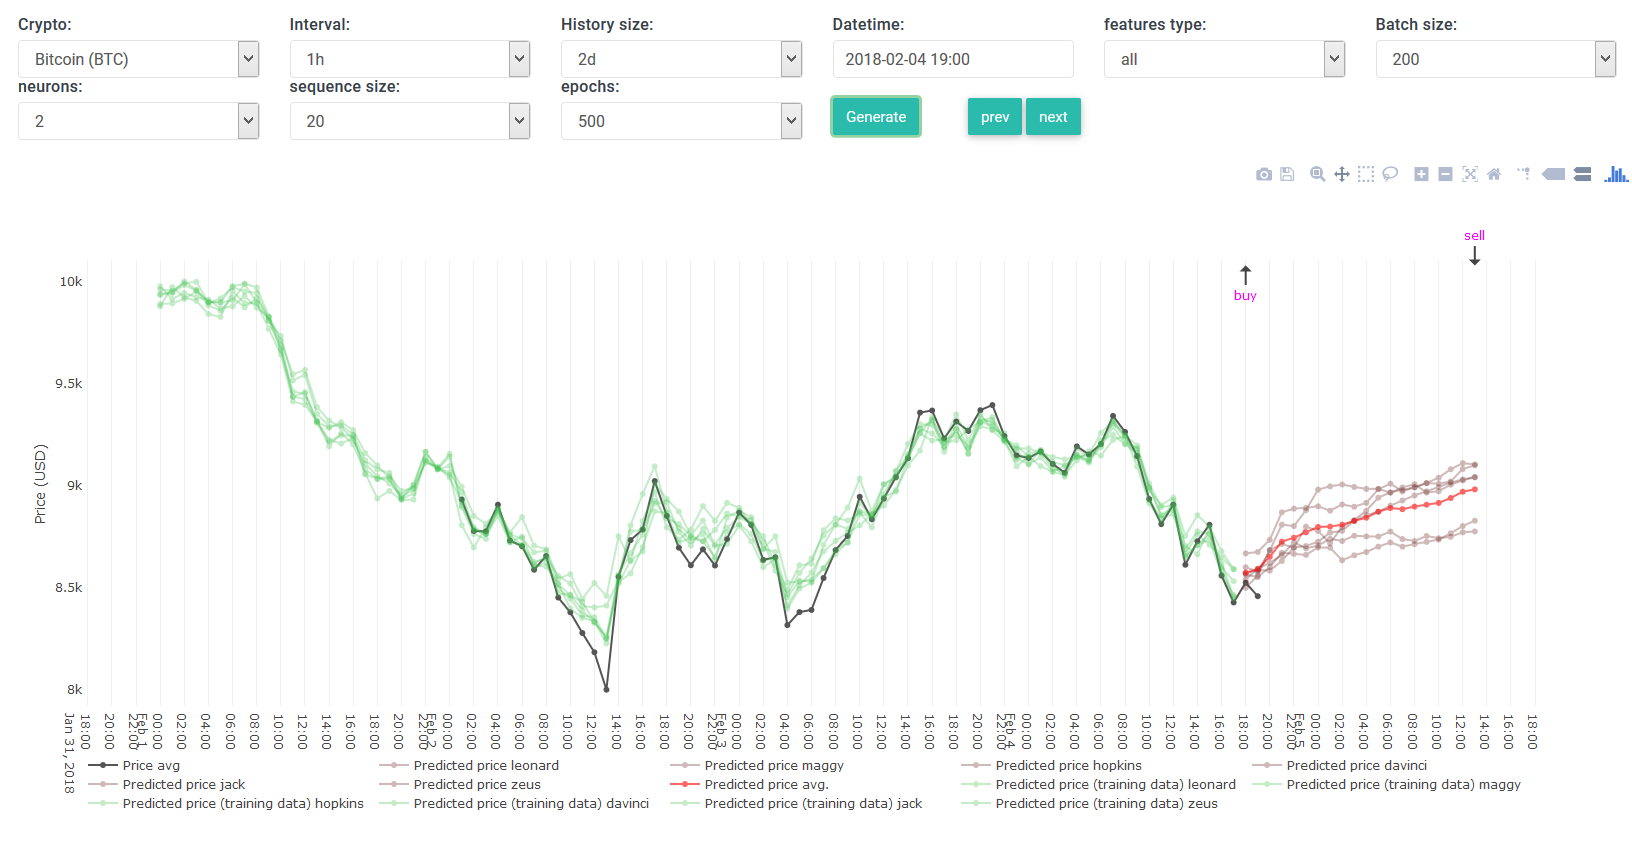
Predicted price avg." line, which is the average of all predictions. And "all" is now the default feature type.
Once this was done, I had to think of how to do backtesting.
The thing is that almost all available libraries do not work by using future predictions, they only use historical data to backtest a certain trading strategy.
On the other hand, at each interval, our tool provides us with a different prediction(s) because it learns and adapts itself.
So I have not yet implemented a fully backtesting function yet, instead I started with adding a
basic signals:
As displayed on the screenshot above, it now indicates when to
buy and
sell based on the average of all predictions.
These signals are super basic, they are just the minimum and maximum within the predicted range. The idea is to
guarantee a profit margin for the trader.
Then if we are at some historical interval (as in our example), we have the extended actual price (black line), and we can calculate ourselves how much we would've made/lost by following the signals. In this case we would have made a profit because we would buy low and sell high several hours later. However, if you are a trader using this basic system, you would be following the market hourly and sell at 14:00, 15:00 or 21:00 instead of at 00:00 as indicated on the chart (to have a higher margin than predicted).
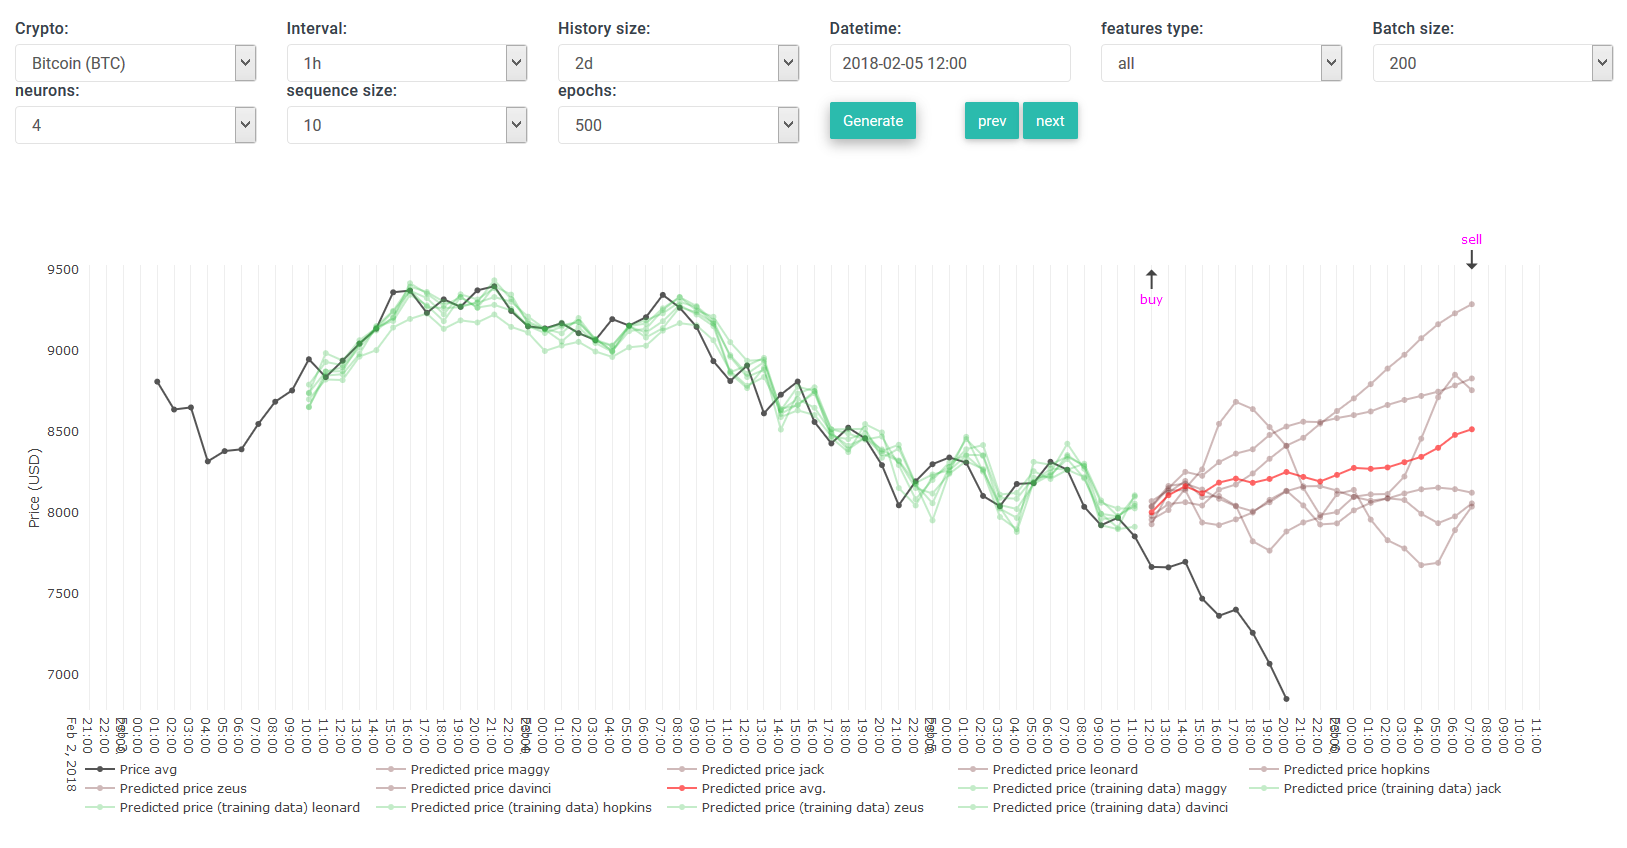
Here's another chart at a more recent historical interval:
As you can see above, there are three signals: two buys and one sell.
It shows three signals when we can have a sell in the middle and the first predicted price ( = buy-price) is lower than the future sell-price.
However, be wary of the 3rd "buy" signal: the predictions do not guarantee there will be an opportunity to sell it later on.
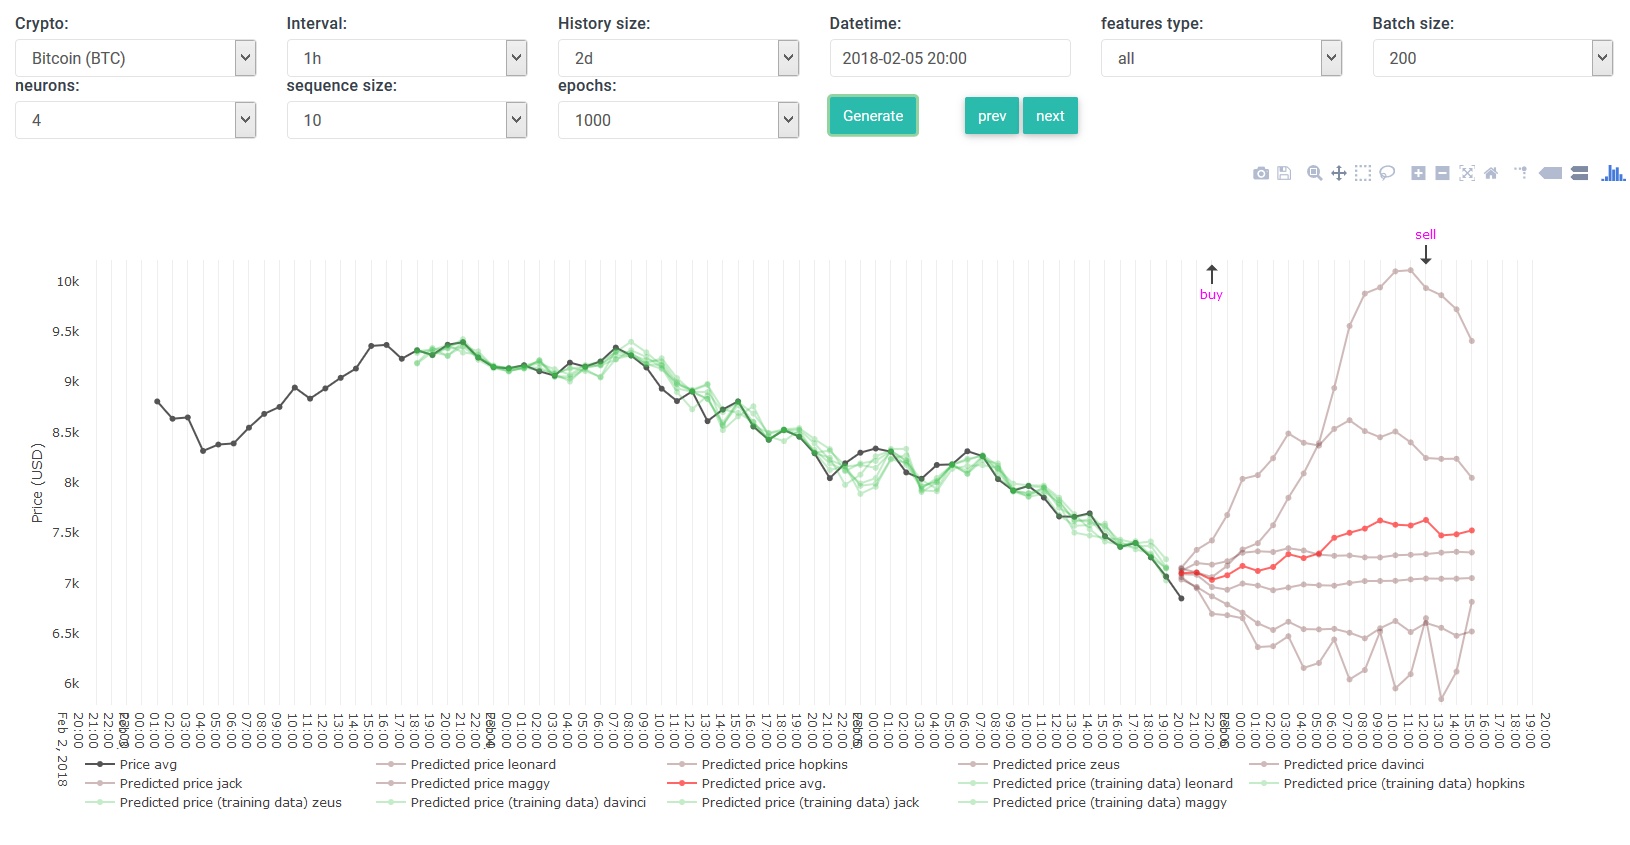
Here's a screenshot of the chart generated right now:
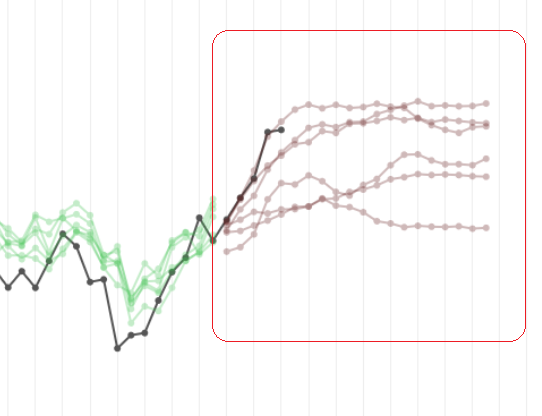
We can see all six prediction graphs predict that the price is going to go up, as a result we see a buy indicator right now.
Stay tuned for more soon.
Have a good day all
- Ilya