Cryptocurrency analysis and predictions using AI and big data

Love the site. Not sure about the domain though ;)

It would be nice if the charts could have horizontal overlays to see the price a bit easier, so I don't have to look at the left side all the time.

It's also slightly weird that you can move the price without moving the other data.

0e2b617fc182f115e58bb97528eb5652.gif
Thanks for the feedback :D
The domain has been carefully chosen (smart marketing tactics haha).

1) I have temporarily disabled the horizontal lines as you mentioned, I'll add an option to toggle it on/off soon.
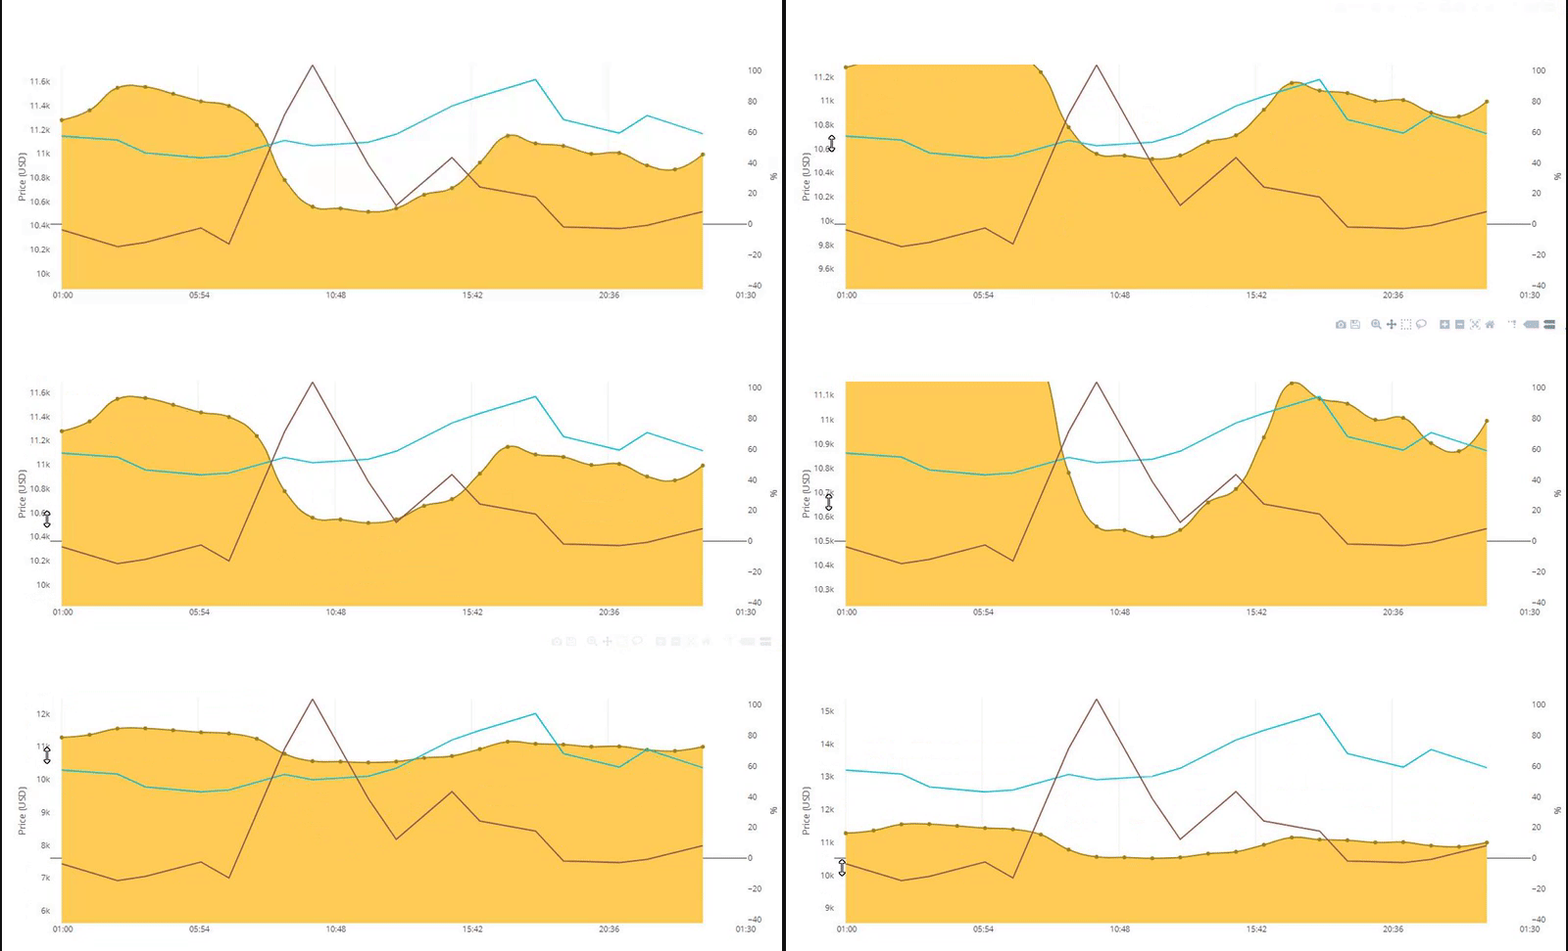
2) The thing is that the price is coupled to the left axis, while all other data (which is relative) is coupled to the right axis. So what you are doing on that GIF is moving the price-axis, but both are completely independent. If we don't do this then the price will be super high (e.g. range of ±10k) while all the other data will be between -100 and 100 and so you wouldn't be able to see anything clearly.

I hope this makes some sense :)
Have a nice weekend.
 
Yes, I understand that, but is there a way to move both of them proportionally?
Well it is always possible to find a way to hack around it.
However, from a practical point of view, how important/necessary is it to move them around? Because all data is clearly visible within in the graph's window, including the drops/rises and trends. Thanks!
 
Hey all :)

Yesterday I had an idea on how to realize @Ensili 's idea of categorizing crypto coins into "stages".
Every coin has a few features that make it unique in the marketplace:
  1. The hype around it (be it news or social media).
  2. The traded volume.
  3. And its price, which is, related to and influenced by, the two above.
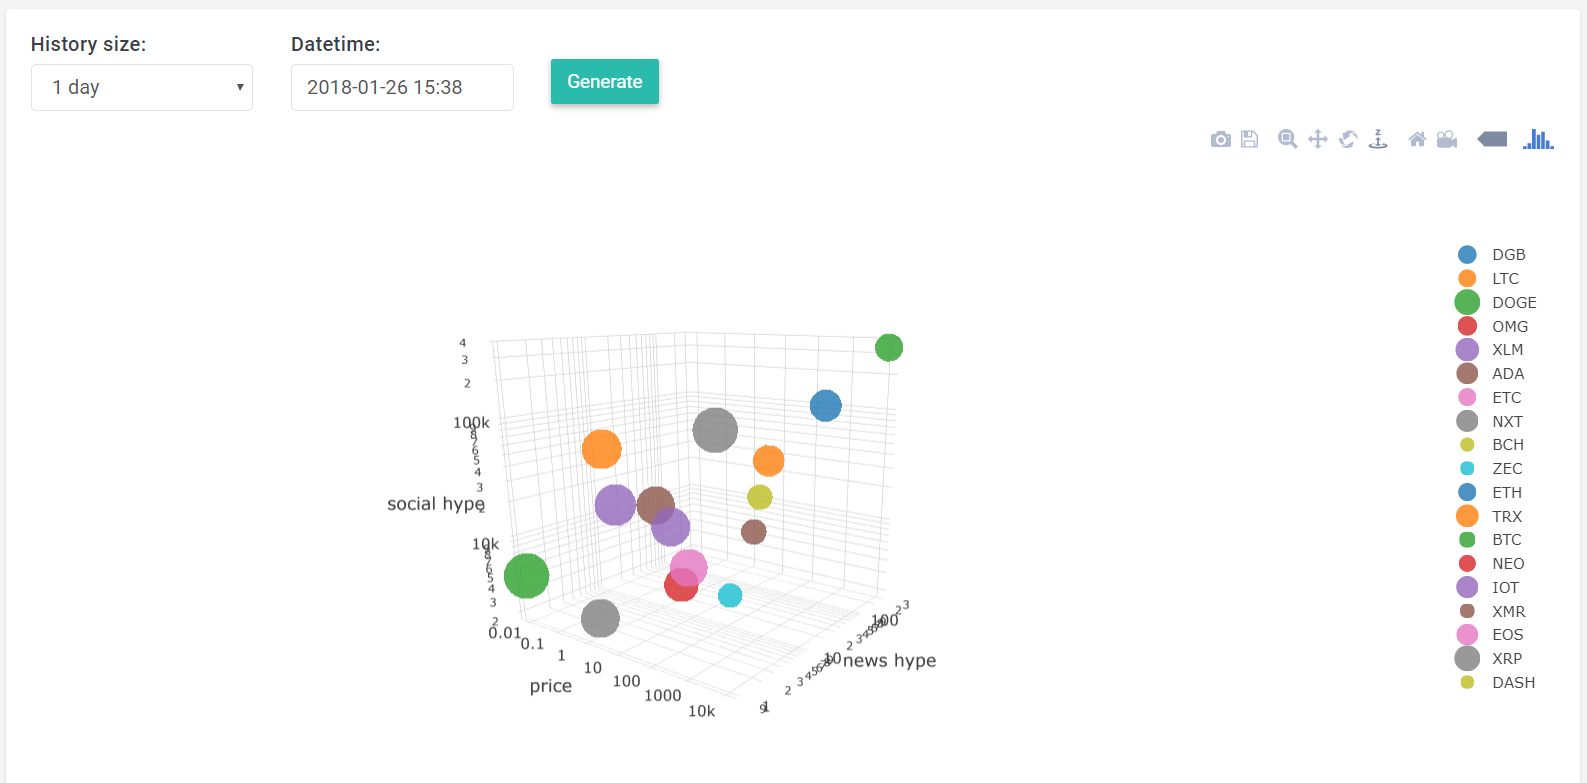
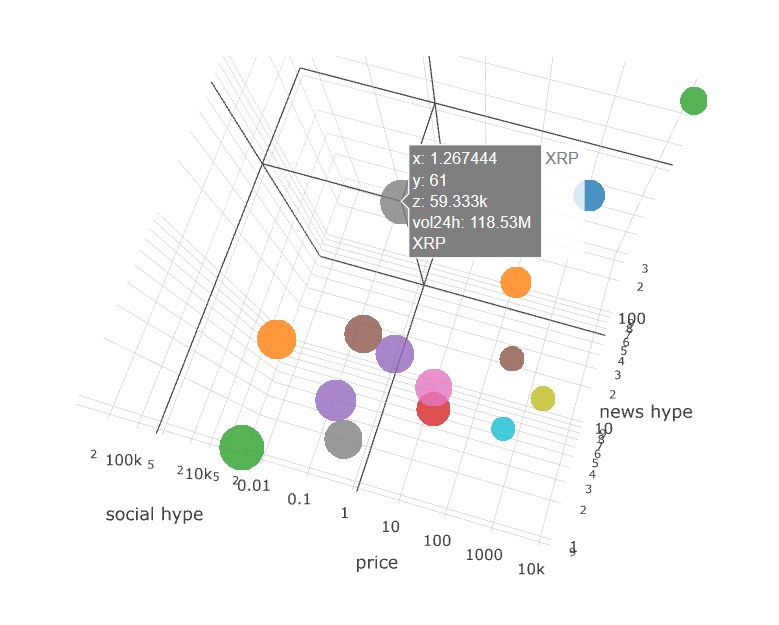
So my thought was to visualize all three features for each coin, at a certain point in time (e.g. the past 24 hours).
We can only (practically) work up to three dimensions, but I have two types of hype: news and social media.
A basic workaround for this problem would be to multiply news mentions by social mentions (unless any is zero).
But if you think about it, we would be very interested in seeing news and social separated.

So I had to introduce a ""4th"" dimension.
This was realized by changing the size of a data-point according to the traded volume (larger dot means more trades).

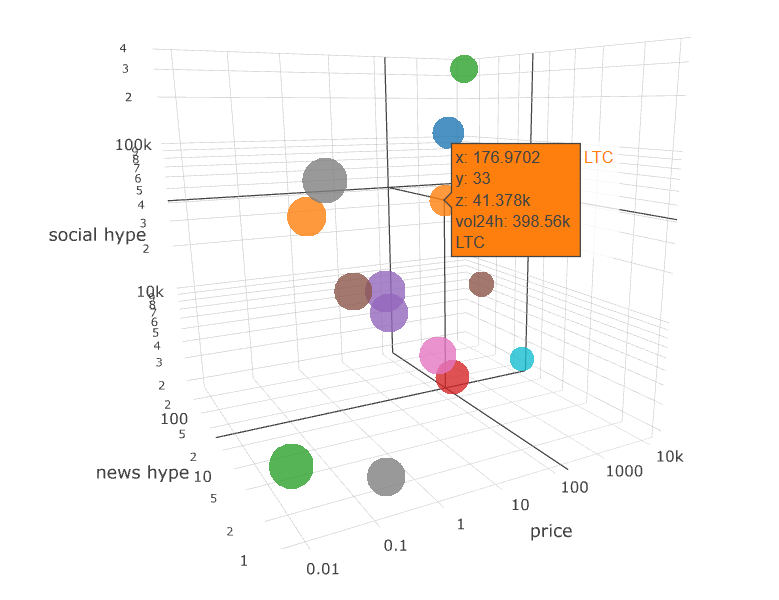
Here's my result:

giphy.gif


7Sk8fv5


AowWScM


1aRgiMv


You can play around with this plot yourself on this link: http://cryptanal.com/stagesPriceHypeVol3d.php
A few notes about the data:
  • In this example we have used data from the past 24 hours.
  • The price of a coin is the average of prices in the past 24 hours.
  • The news hype is the sum of news mentions in the past 24hrs.
  • The social hype is idem ditto ^.
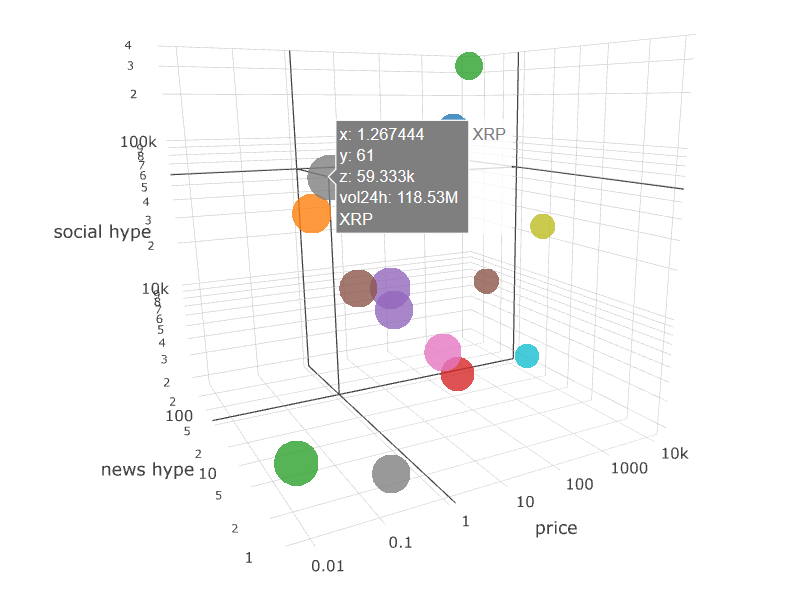
  • Volume: some coins (e.g. XRP) have a traded volume24h of hundreds of millions, while others (e.g. BTC) are between 80k and 180k. So to display the size of a dot properly we have a formula like: dot_size = log( vol24h**2 )/log(6) . If we don't take the log, we'll end up with crazy large dots that take the entire plot size.

  • x axis is the price
    y axis is news mentions
    z axis is social mentions

You will see that Bitcoin is at the highest stage, followed by ETH and then LTC.
We also see that BTC, ETH and LTC are lining up, and it seems that IOT and/or XMR will be next to line-up.

It's also very cool to see which coins are heavily traded (e.g. DOGE) but are very low on social/news mentions.
XRP is the most heavily traded one, and floats in its own "zone", away from the masses:
8NPfxth


A next step for "staging" coins would be to show their respective paths.
I mean, it would be even more meaningful if we could see how a certain coin (e.g. LTC) evolved in the past 3 months.
Once we can visualize its path, we could see which coins have followed a similar path as LTC did and might go to where LTC is now (within X weeks/months).

Have a great day all! :)
- Ilya

Amazing man! I was waiting this, Really good job, keep it Up!
 
Hi guys :)

I have got something exciting for you.
Today and yesterday I have invested all my time implementing the auto-prediction system.
This new feature automatically generates predictions for every coin.
Right now it makes 4 predictions per coin, for 4 different intervals: 30min, 60min, 12hrs and 24hrs.
Basically It predicts 20 intervals into the future depending on the interval you choose.

Here are a few screenshots before I go into more details.

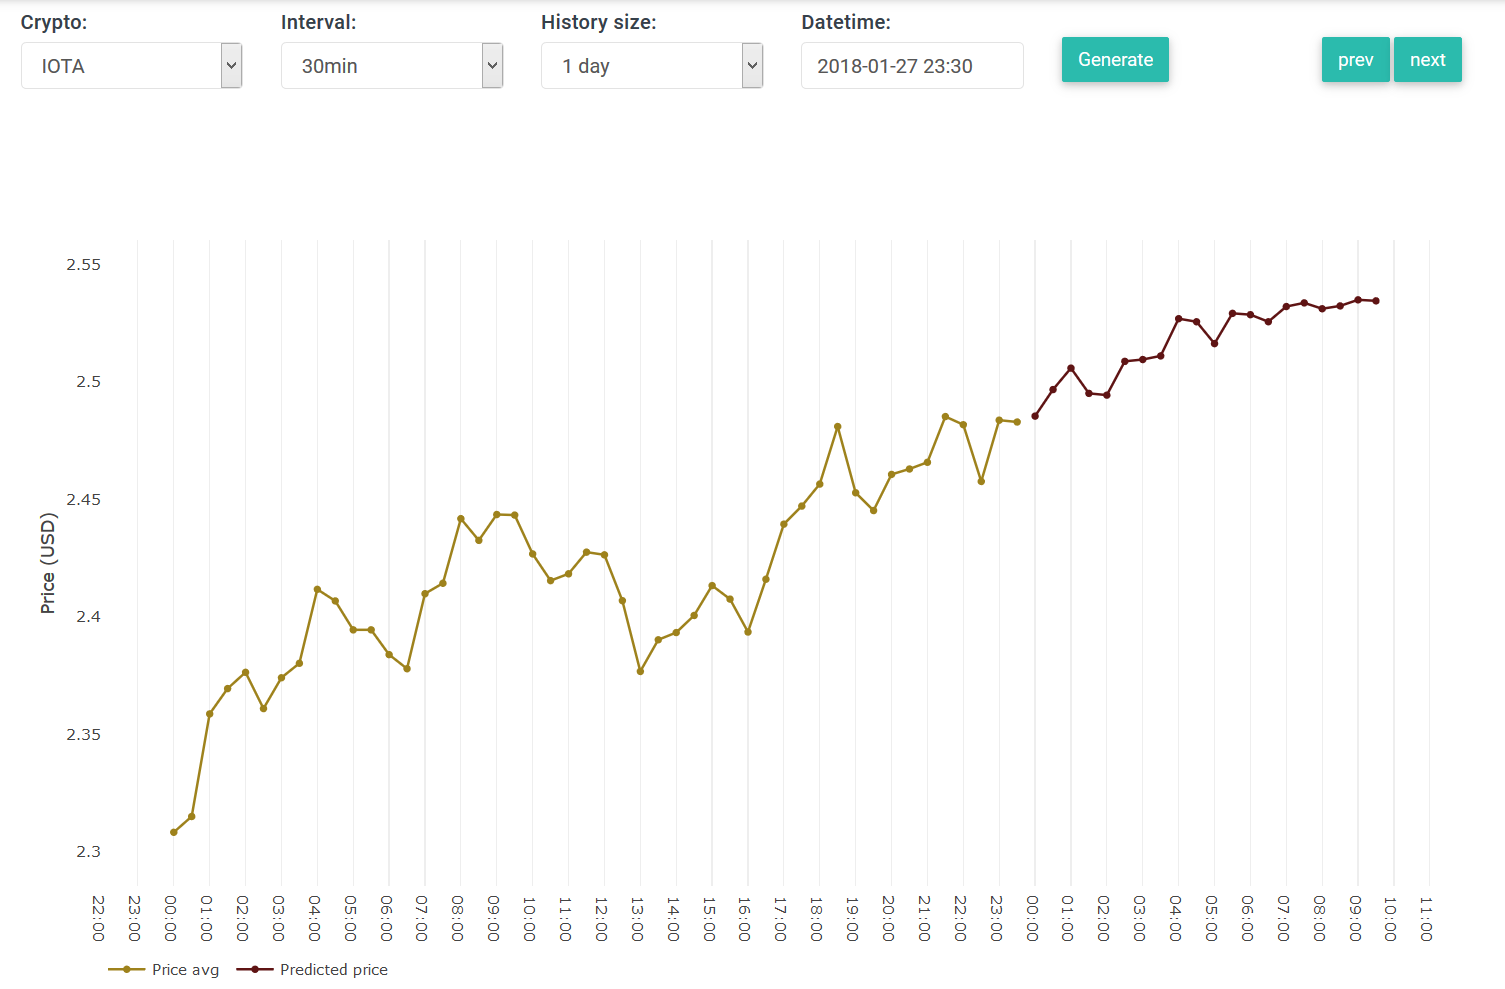
IOTA, 30min intervals:
XGZ8R0D


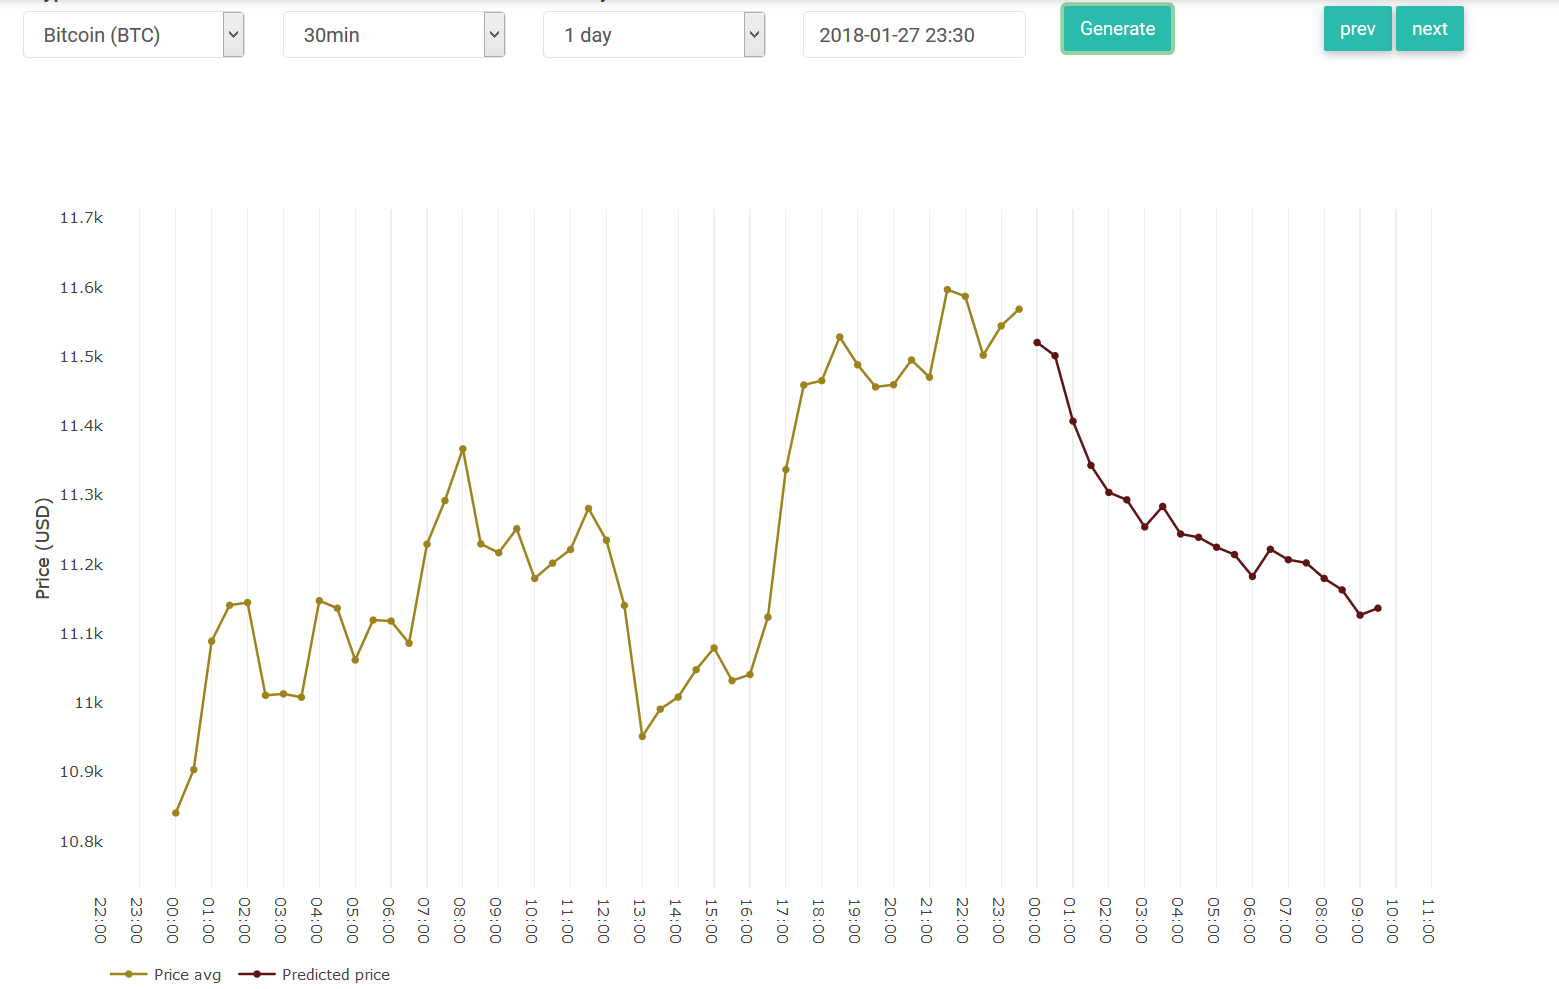
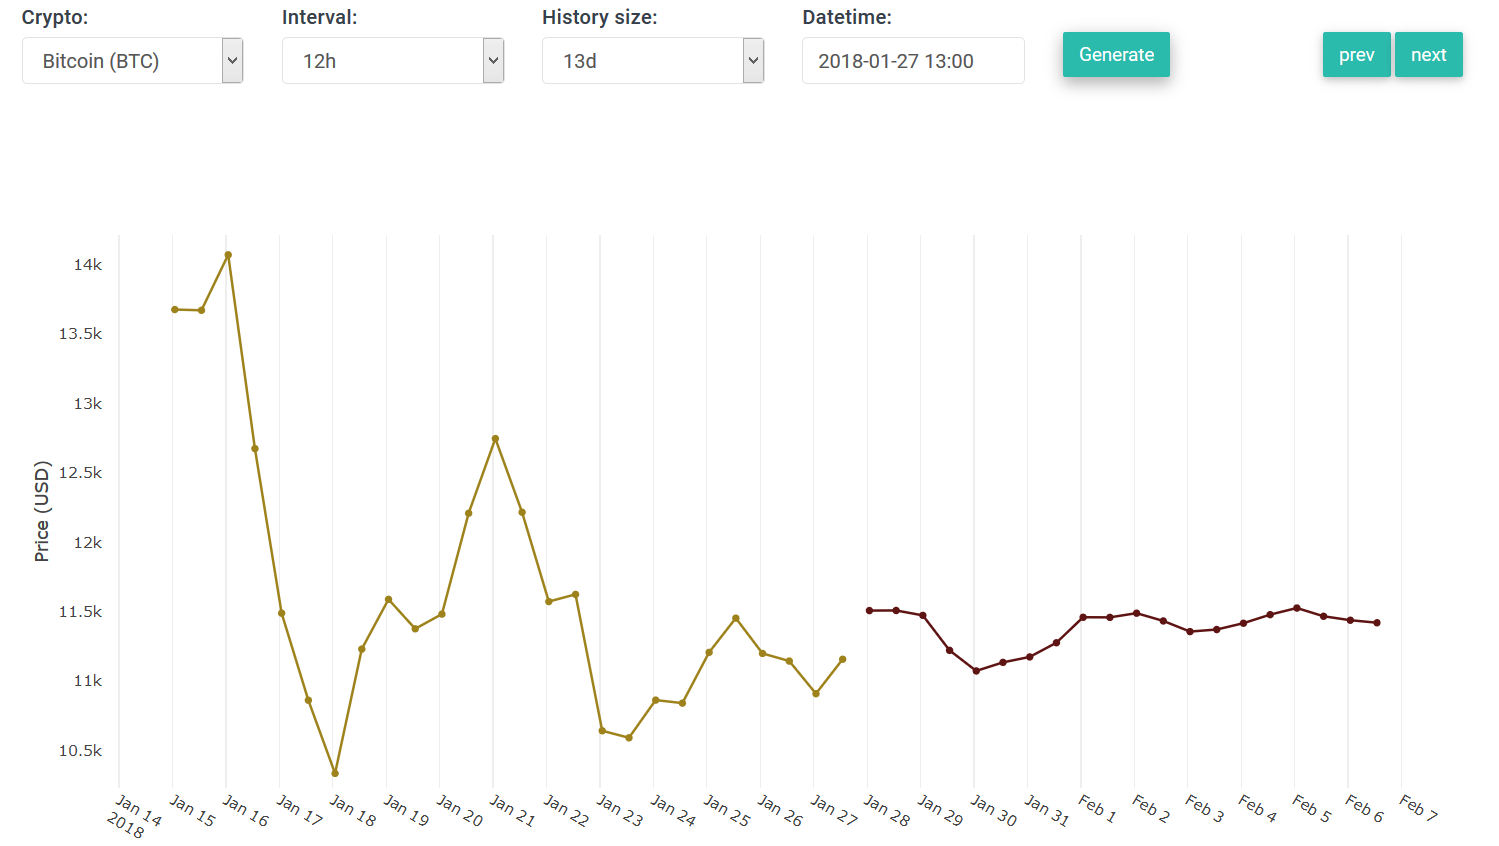
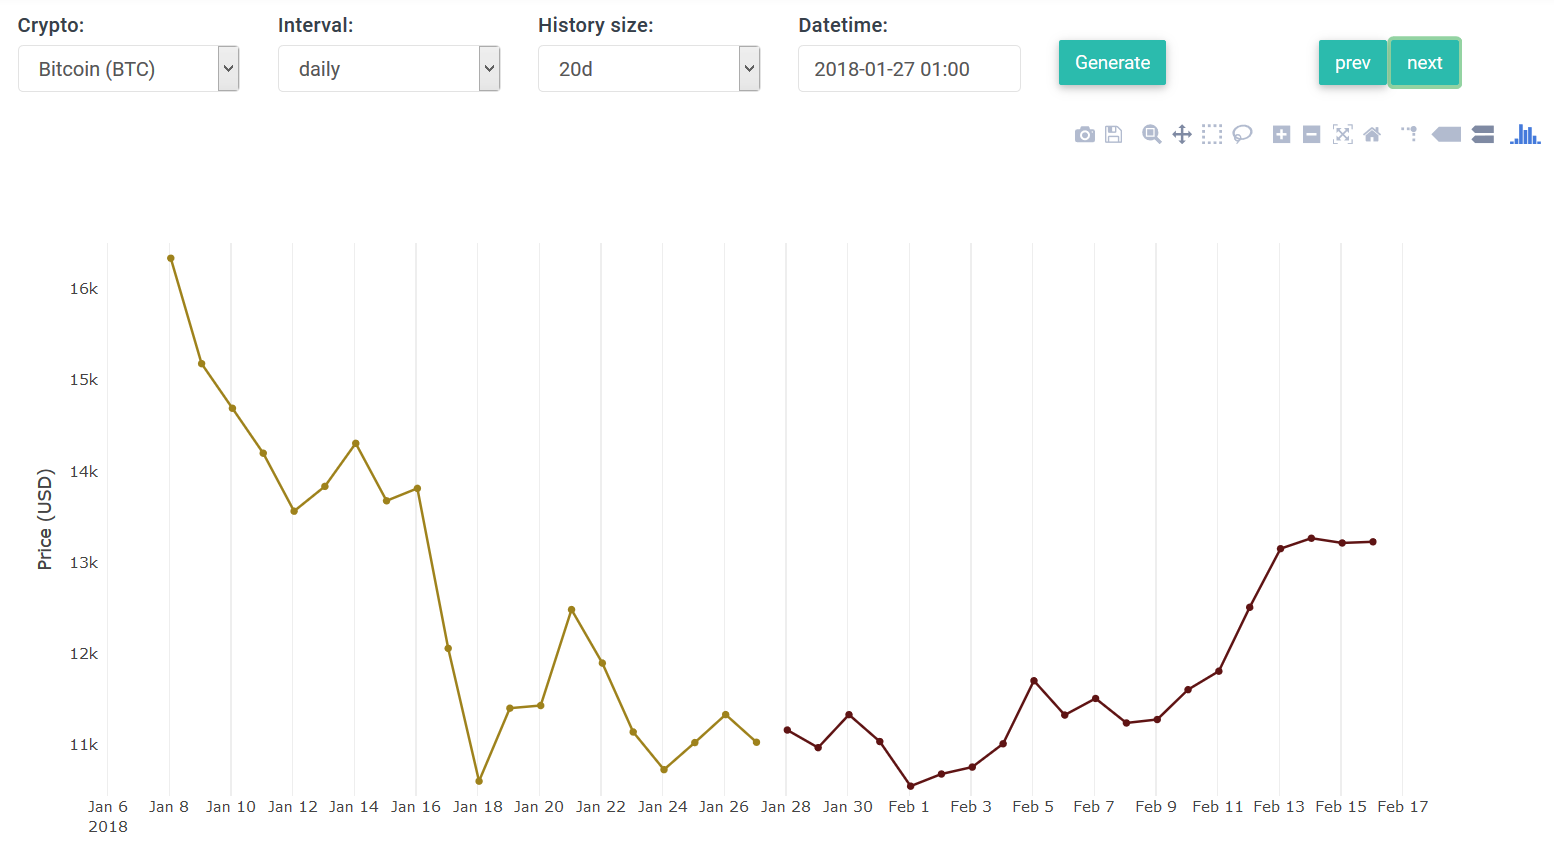
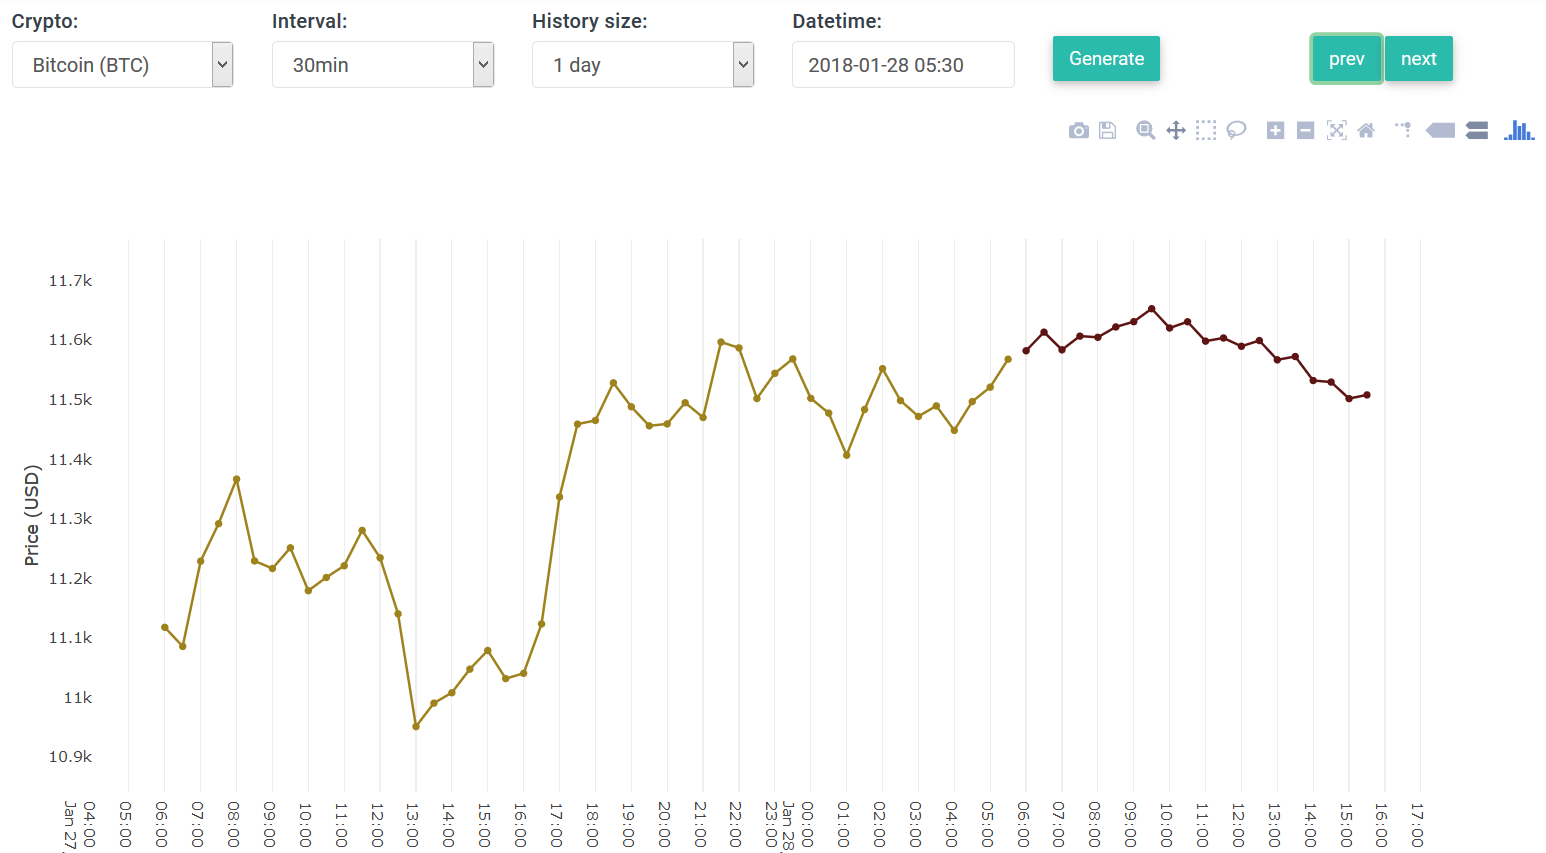
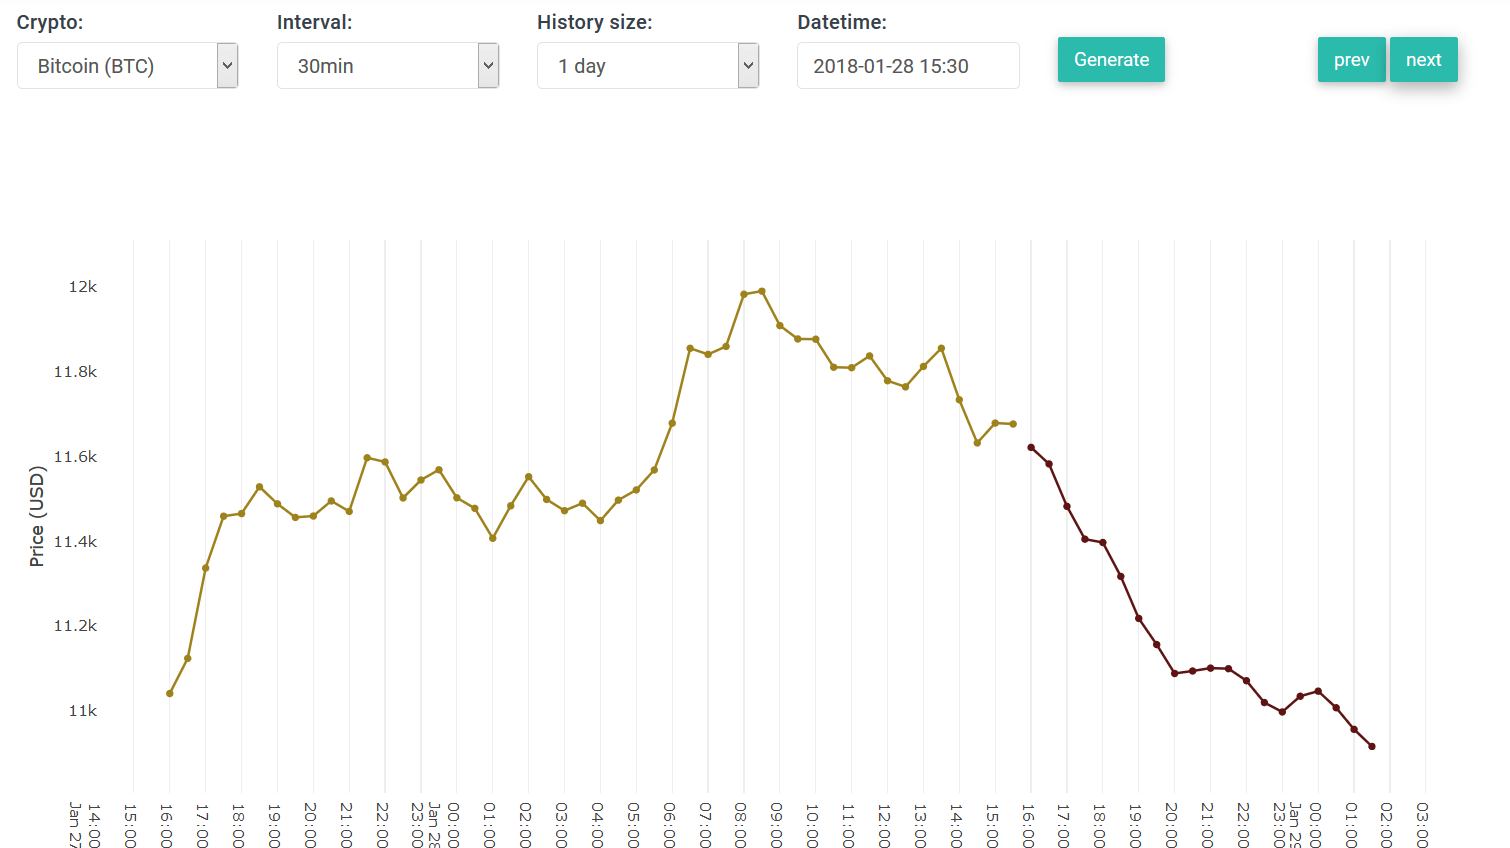
BTC: 30min, 12hr and 24hr intervals:
WuFMLEC


cx6Dp97


b26Kwsq


A few technical notes:
Every 30 minutes
the system generates a prediction per crypto and per interval.
There is a reason for generating a prediction for each possible interval: remember that we noticed that the predictions are only accurate for about 5 - 12 intervals into the future. So for instance if we would want to predict 20 days ahead, we don't want to use 30min intervals to generate 960 prediction-points. So instead we train the model on the 24hr-based data and make 20 prediction-points from it.

Feel free to use the tool here: http://cryptanal.com/predictionsChart.php
When you are going to use the prediction tool, you may see an empty chart -- this is because it has not generated a prediction (yet) for the datetime you selected.
Simply click "prev" and/or wait until the new prediction is made.

You can use the "prev"/"next" button to go to the previous/next interval. I added the prev/next buttons to see which predictions were made in the past, so we can compare history against reality. However, only a limited number of predictions have been recorded until now (only the most recent ones), so you will not find a prediction made e.g. 10 days ago.

On the gif below you can see how the prediction evolves when pressing "next" (I started at some historic datetime):
giphy.gif

Notice that each prediction looks (slightly) different from the previous one.
This is because the neural network is re-adjusted with the new data (continuous learning) every interval.

In one of my earlier posts I explained that there are a bunch of parameters/configurations for the prediction algorithm.
I have not yet figured out which parameters are the "optimal" ones, this is not a trivial task but it will be done in the near future.
So the current algorithm uses the parameters which gave me the best results thus far:
  • Sequence length: 20 intervals
  • Features: 5 (price, volume24, social hype, sentiments from news articles, sentiments from social media)
  • Neurons: 2
  • Epoch: 500
  • batch size: 20
Regarding the price and volume: I may not have mentioned this before, but the price we record is the average price of a cryptocurrency across all mainstream exchanges. The same is true for the traded volume, the system takes the average of the traded volume across all exchanges. Maybe in the future I will implement per-exchange charts which is useful to very serious traders.

Apart from implementing the prediction tool, I have patched a few bugs.
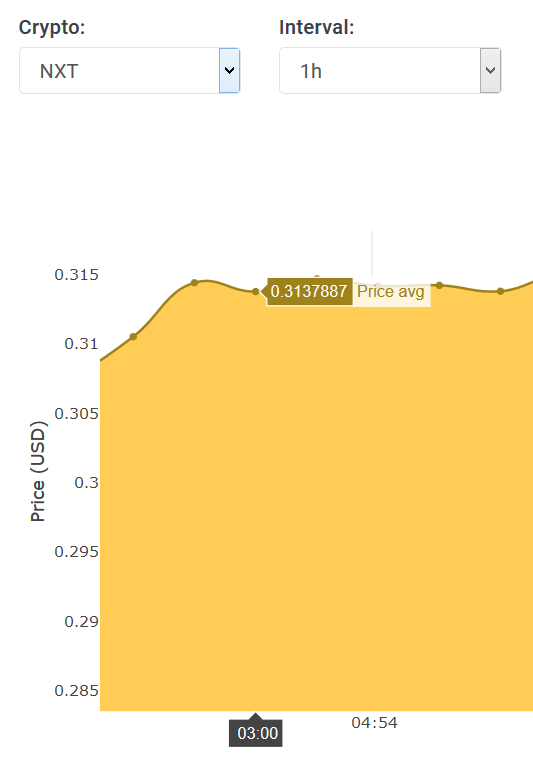
The most important one is displaying more digits after the decimal point/comma. Previously it was rounded to 2 digits, but I noticed that some coins are worth less than one US Dollar (e.g. NXT):
bZxecuF


Thanks for reading, I love all of your support and feedback!!! :)
Would love to hear your thoughts on this one as well.
- Ilya
 
Last edited:
You should also look at time of day & day of the week.

Some coins are more active on certain time zones and go down on specific days like weekends.
 
You should also look at time of day & day of the week.

Some coins are more active on certain time zones and go down on specific days like weekends.
Thanks :)
That is very true. Luckily the neural network takes these parameters into account implicitly as it learns when volume/price goes up or down.
I'm not sure whether feeding the day of week and/or time of day into the neural net would yield additional value, but definitely something worth trying out.
 
ICOs are not yet supported and will require different analyses. :)
I may look into that very soon.
I am also looking at automating ICOs. Really hard (pretty much impossible) to predict sucess automatically.

I know that the Cindicator bot offers ICO rating, and you could maybe use ICOBench's API but it's honestly just easier to spend an hour or so researching each ICO yourself.
 
I am also looking at automating ICOs. Really hard (pretty much impossible) to predict sucess automatically.

I know that the Cindicator bot offers ICO rating, and you could maybe use ICOBench's API but it's honestly just easier to spend an hour or so researching each ICO yourself.
Awesome, thanks for sharing these sources.
I'll definitely try to use them. :) Cheers!
 
I'll definitely try to use them.
Cindicator bot requires xx,xxx-xxx,xxx holdings of their coin, so it's not easy to see what it does exactly.

You may find this video interesting. The guy in it is a bit weird, but great info.

 
Hey as always good job! I'm a big fan of this project, will you do cryptocurrency only or add on the big stocks in the future?
 
WOW! Well done!
I have not read all the posts so please disregard this suggestion if it has already been posted. If I could suggest it would be useful to included social indicators for trading. What do I mean? Well, for instance, there is a bot that tracks "mentions" of crypto coins on twitter. Google trends also indicate interest in buy or selling coins. I read (somewhere/sometime) ago an article that listed and discussed the "social indicators" of trading... but of course, I can't find it now to post here?! You may wish to keep it separate at first and study the correlations to the actuals? You will decide of course whether there is merit in including some the indicators in your price predictions. Again well done and thank you for work. Cheers.
 
WOW! Well done!
I have not read all the posts so please disregard this suggestion if it has already been posted. If I could suggest it would be useful to included social indicators for trading. What do I mean? Well, for instance, there is a bot that tracks "mentions" of crypto coins on twitter. Google trends also indicate interest in buy or selling coins. I read (somewhere/sometime) ago an article that listed and discussed the "social indicators" of trading... but of course, I can't find it now to post here?! You may wish to keep it separate at first and study the correlations to the actuals? You will decide of course whether there is merit in including some the indicators in your price predictions. Again well done and thank you for work. Cheers.
Hey, thanks for the feedback :)
If I understand your correctly, then we already have that implemented. It is actually our entire backbone.
Per crypto we track the mentions (aka hype) on Twitter, Facebook and Reddit (these are the social channels).
But we also track them on big news sites (cnn, cnbc, bbc, ... and 30+ others).
Soon I would like to expand to blogs and forums as well.
Hope this answers your question?

Hey as always good job! I'm a big fan of this project, will you do cryptocurrency only or add on the big stocks in the future?
Thanks man, I love your support!
I had this conversation with a few people some time ago.
It would be really great if we could expand to the traditional stock market as well -- that's more of a long-term goal and has a lot of its own challenges.

Cheers!
 
Hi guys :)

I have got something exciting for you.
Today and yesterday I have invested all my time implementing the auto-prediction system.
This new feature automatically generates predictions for every coin.
Right now it makes 4 predictions per coin, for 4 different intervals: 30min, 60min, 12hrs and 24hrs.
Basically It predicts 20 intervals into the future depending on the interval you choose.

Here are a few screenshots before I go into more details.

IOTA, 30min intervals:
XGZ8R0D


BTC: 30min, 12hr and 24hr intervals:
WuFMLEC


cx6Dp97


b26Kwsq


A few technical notes:
Every 30 minutes
the system generates a prediction per crypto and per interval.
There is a reason for generating a prediction for each possible interval: remember that we noticed that the predictions are only accurate for about 5 - 12 intervals into the future. So for instance if we would want to predict 20 days ahead, we don't want to use 30min intervals to generate 960 prediction-points. So instead we train the model on the 24hr-based data and make 20 prediction-points from it.

Feel free to use the tool here: http://cryptanal.com/predictionsChart.php
When you are going to use the prediction tool, you may see an empty chart -- this is because it has not generated a prediction (yet) for the datetime you selected.
Simply click "prev" and/or wait until the new prediction is made.

You can use the "prev"/"next" button to go to the previous/next interval. I added the prev/next buttons to see which predictions were made in the past, so we can compare history against reality. However, only a limited number of predictions have been recorded until now (only the most recent ones), so you will not find a prediction made e.g. 10 days ago.

On the gif below you can see how the prediction evolves when pressing "next" (I started at some historic datetime):
giphy.gif

Notice that each prediction looks (slightly) different from the previous one.
This is because the neural network is re-adjusted with the new data (continuous learning) every interval.

In one of my earlier posts I explained that there are a bunch of parameters/configurations for the prediction algorithm.
I have not yet figured out which parameters are the "optimal" ones, this is not a trivial task but it will be done in the near future.
So the current algorithm uses the parameters which gave me the best results thus far:
  • Sequence length: 20 intervals
  • Features: 5 (price, volume24, social hype, sentiments from news articles, sentiments from social media)
  • Neurons: 2
  • Epoch: 500
  • batch size: 20
Regarding the price and volume: I may not have mentioned this before, but the price we record is the average price of a cryptocurrency across all mainstream exchanges. The same is true for the traded volume, the system takes the average of the traded volume across all exchanges. Maybe in the future I will implement per-exchange charts which is useful to very serious traders.

Apart from implementing the prediction tool, I have patched a few bugs.
The most important one is displaying more digits after the decimal point/comma. Previously it was rounded to 2 digits, but I noticed that some coins are worth less than one US Dollar (e.g. NXT):
bZxecuF


Thanks for reading, I love all of your support and feedback!!! :)
Would love to hear your thoughts on this one as well.
- Ilya
Based on the last gif where you show how your predictions evolve and the real stats proceed over time it seems like they are not even close to be accurate.

I am wondering if flipping a coin for each interval with the options for 'up' and 'down' would result in more accurate predictions.
 
Healzer,
This is a great thread and project, I'm just sorry I got in so late.
I day trade Crypto and current use scanners to find coins that are going up but I only scalp 2 - 5% or more if I know for sure how much it will go up in a very very very short period of time using the 5min Candles.
I have been planning to Diversify a little more:
DayTrade - 70%
HODL - 15%
ICO - 15%
 
Based on the last gif where you show how your predictions evolve and the real stats proceed over time it seems like they are not even close to be accurate.

I am wondering if flipping a coin for each interval with the options for 'up' and 'down' would result in more accurate predictions.
Great question!
On first sight it may appear to be inaccurate, but there is a reason for that.
Allow me to explain how it works.

Here is the gif @ses is referring to:
giphy.gif


A certain frame on this gif is the chart below.
It was generated for the interval 22:00 --> 22:30 (GMT+1).
And it shows that the price is most likely to crash/go down from 11.5k to 10.9k:

F7fNrGH


But after a few hours its outcome has been adjusted.
It learned that the price didn't crash so the outcome started to change:

dWItOcJ


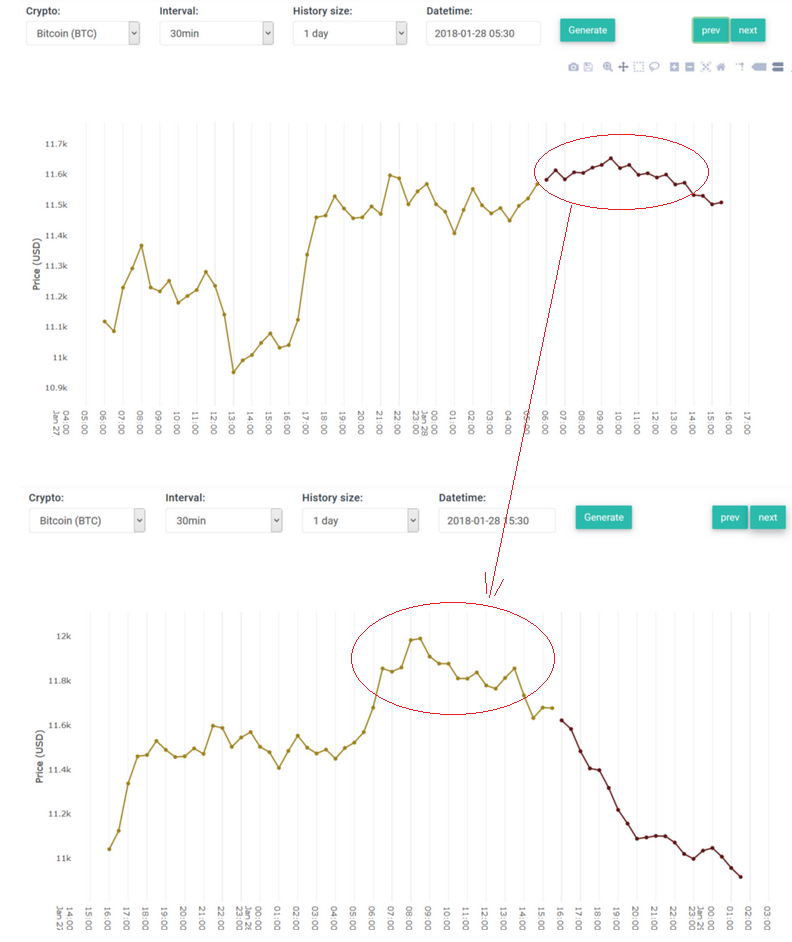
But if we look on the screenshot below, and compare it with the prediction above from 06:00 to 12:00 , it appears to be a pretty good prediction of how the price evolved. At first it went up a little in the first few hours and then slowly started going down. But right now (as I am writing this post), it indicates the price may crash/go down again:

5YNXk2M


*edit* Here's an easier way to look at what I mean:
5YLa6fE


It's important to remember that the screenshots above all use 30min intervals. So the neural network is only trained on plots at 30min intervals, it's not very good at predicting e.g. +8 hours into the future because that's already 16 intervals it has to predict, while we noticed it's only good for up to 5-10 intervals into the future.
So to tackle this problem you may want to use hourly/12h/daily intervals instead:


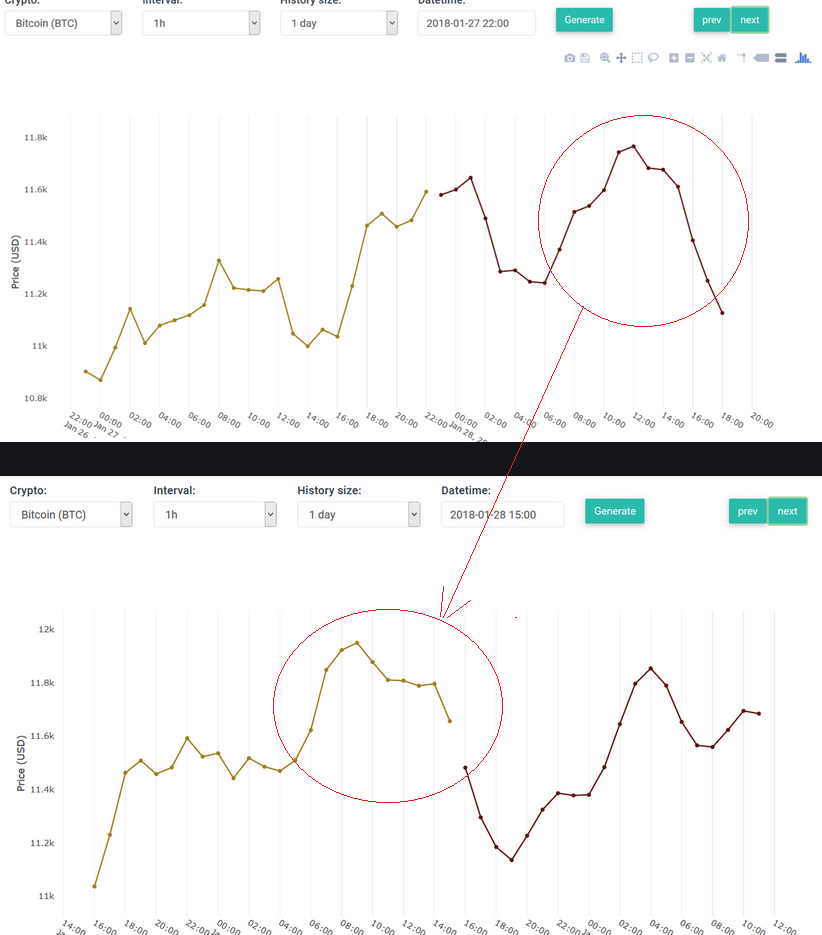
Below are two screenshots which use hourly intervals.
The first one makes a prediction on Jan 27, 22:00 for the next 20 hours:
WwXT8P1


The second one I have pulled from the site right now and shows how the price evolved, including its prediction:
dP9pWq0


Now we can compare the first prediction with the 2nd screenshot's actual data.
Now find the x-tick "Jan 27, 22:00" on both screenshots and look how the prediction differs from actual data.
We do see that at 02:00 --> 06:00 the prediction showed it would go down, the reality was less worse than indicated, we did have a dip at 01:00 and at 04:00.
Then from 06:00 until 14:00 the price went up and both areas look very similar, so the prediction is pretty accurate for this zone.
Here is a better illustration of what I mean:
XriFo8K


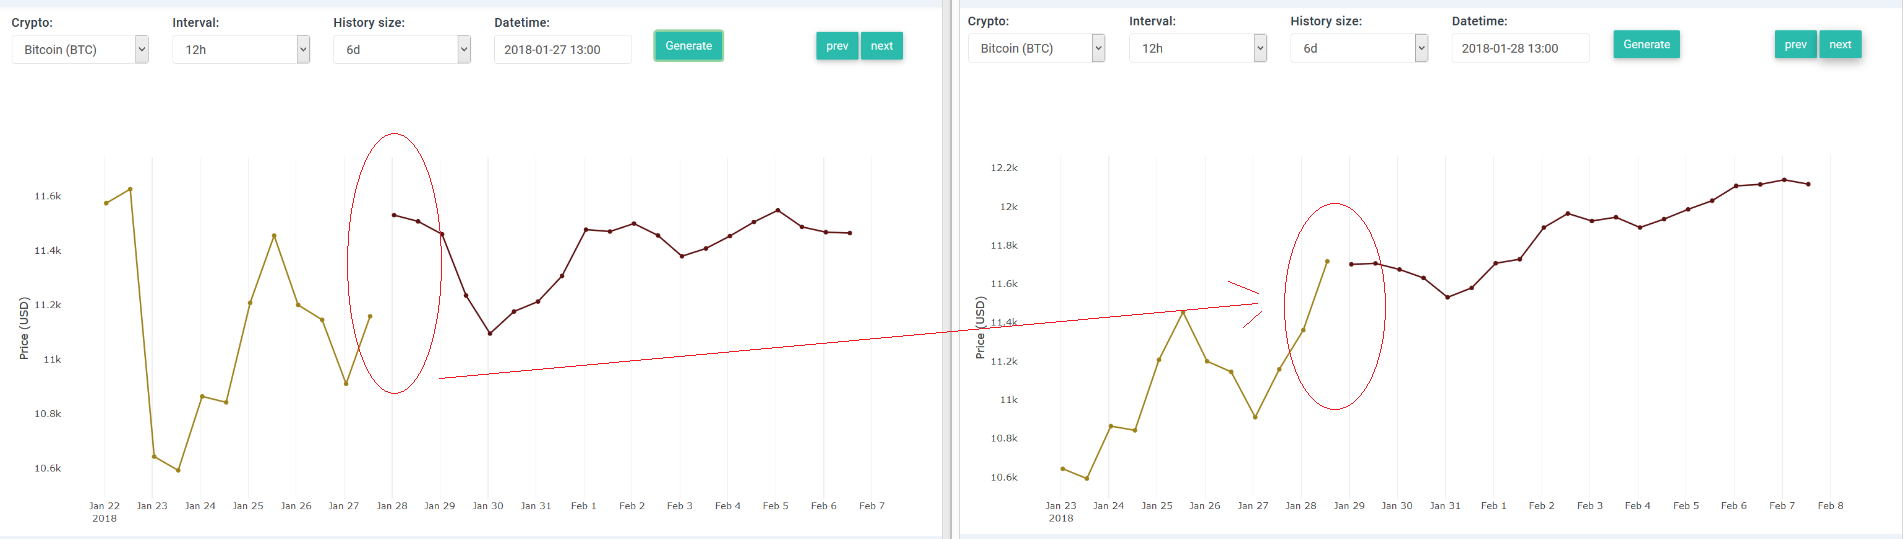
And finally, for the 12hr interval we have the following (see image below).
It predicted the price to go up to 11.5k and so it did in reality.
dfjxIgl


On first sight it appears that hourly/12h intervals are much more accurate than 30min intervals.
We don't have enough data yet to analyze the 24hr intervals, but in due time we'll dig deeper.

I hope this clears things up a bit :)
 
Last edited:
Great question!
On first sight it may appear to be inaccurate, but there is a reason for that.
Allow me to explain how it works.

Here is the gif @ses is referring to:
giphy.gif


A certain frame on this gif is the chart below.
It was generated for the interval 22:00 --> 22:30 (GMT+1).
And it shows that the price is most likely to crash/go down from 11.5k to 10.9k:

F7fNrGH


But after a few hours its outcome has been adjusted.
It learned that the price didn't crash so the outcome started to change:

dWItOcJ


But if we look on the screenshot below, and compare it with the prediction above from 06:00 to 12:00 , it appears to be a pretty good prediction of how the price evolved. At first it went up a little in the first few hours and then slowly started going down. But right now (as I am writing this post), it indicates the price may crash/go down again:

5YNXk2M


*edit* Here's an easier way to look at what I mean:
5YLa6fE


It's important to remember that the screenshots above all use 30min intervals. So the neural network is only trained on plots at 30min intervals, it's not very good at predicting e.g. +8 hours into the future because that's already 16 intervals it has to predict, while we noticed it's only good for up to 5-10 intervals into the future.
So to tackle this problem you may want to use hourly/12h/daily intervals instead:


Below are two screenshots which use hourly intervals.
The first one makes a prediction on Jan 27, 22:00 for the next 20 hours:
WwXT8P1


The second one I have pulled from the site right now and shows how the price evolved, including its prediction:
dP9pWq0


Now we can compare the first prediction with the 2nd screenshot's actual data.
Now find the x-tick "Jan 27, 22:00" on both screenshots and look how the prediction differs from actual data.
We do see that at 02:00 --> 06:00 the prediction showed it would go down, the reality was less worse than indicated, we did have a dip at 01:00 and at 04:00.
Then from 06:00 until 14:00 the price went up and both areas look very similar, so the prediction is pretty accurate for this zone.
Here is a better illustration of what I mean:
XriFo8K


And finally, for the 12hr interval we have the following (see image below).
It predicted the price to go up to 11.5k and so it did in reality.
dfjxIgl


On first sight it appears that hourly/12h intervals are much more accurate than 30min intervals.
We don't have enough data yet to analyze the 24hr intervals, but in due time we'll dig deeper.

I hope this clears things up a bit :)
I exported a report for the next several days in the 12h interval and will check how accurate it is.
 
Last edited by a moderator:
Back
Top